I capped an RTX 5090 thirty watts above its stock 575W TDP. That run finished only 1.8% faster than the 575W baseline but consumed 2.4% more total energy for the exact same training job. I got those numbers by timing the full training loop in PyTorch and multiplying average wall draw by elapsed seconds.
GPU utilization stayed pinned at 99% across every limit I tested. Lowering the cap doesn’t starve the cores — it just slows the clock.
A 400W limit stretches training time by 23%, yet the whole job uses 14% less electricity than at 575W. For a home box, 475W–500W feels like the sweet spot. You lose roughly 7–11% speed but gain a real thermal safety margin.
Method
Hardware
The test bench was an open-air rig: RTX 5090 FE with 32 GB GDDR7, paired with a Ryzen 9 9900X on 64 GB DDR5-6400. Storage was a 2 TB NVMe Gen4 drive. The PSU was a Corsair RM1000e.
The table below has the full spec breakdown.
| Component | Specification |
|---|---|
| GPU | NVIDIA GeForce RTX 5090 FE (32 GB GDDR7) |
| CPU | AMD Ryzen 9 9900X (12c/24t) |
| RAM | 64 GB DDR5-6400 |
| Storage | 2 TB NVMe Gen4 |
| PSU | Corsair RM1000e |
| Case | Open-air test bench, 3× 140mm intake |
Software
The stack ran on Debian 13 with kernel 6.12. I used Python 3.13, PyTorch 2.6.0+cu128, and CUDA 12.8. The driver was 570.86.10.
| Tool | Version |
|---|---|
| OS | Debian 13 (kernel 6.12) |
| Python | 3.13 |
| PyTorch | 2.6.0+cu128 |
| CUDA | 12.8 |
| Driver | 570.86.10 |
Model & task
I trained a decoder-only transformer — a standard LLM architecture — on integer addition. The model had 60M parameters across 6 layers, 512 dims, and 8 heads. Context length was 16 tokens with a vocab of 20 tokens. I ran full-batch training for 3 epochs with AdamW at lr=3e-4. No warmup, no scheduler.
- 6 layers, 512-dim embeddings, 8 attention heads
- Context length: 16
- Vocabulary: 20 tokens (0–9, padding, special)
- Dataset: 50,000 training examples (~1.8 M tokens total)
- Training: full-batch, 3 epochs, AdamW, lr=3e-4, no warmup, no scheduler
Power limit protocol
nvidia-smi — NVIDIA’s command-line system management interface — set the cap before each run. I verified actual draw with nvidia-smi dmon, which prints per-second power metrics in the terminal.
| |
I ran limits at 400 W, 450 W, 500 W, 575 W, and 600 W. The 575W setting matches the card’s stock TDP. The 600W ceiling is the firmware maximum. I spaced each run with a 60-second idle cooldown so the heatsink could return to room temperature.
Reproduction:
| |
Raw numbers: results.json
Results
Wall time vs power limit
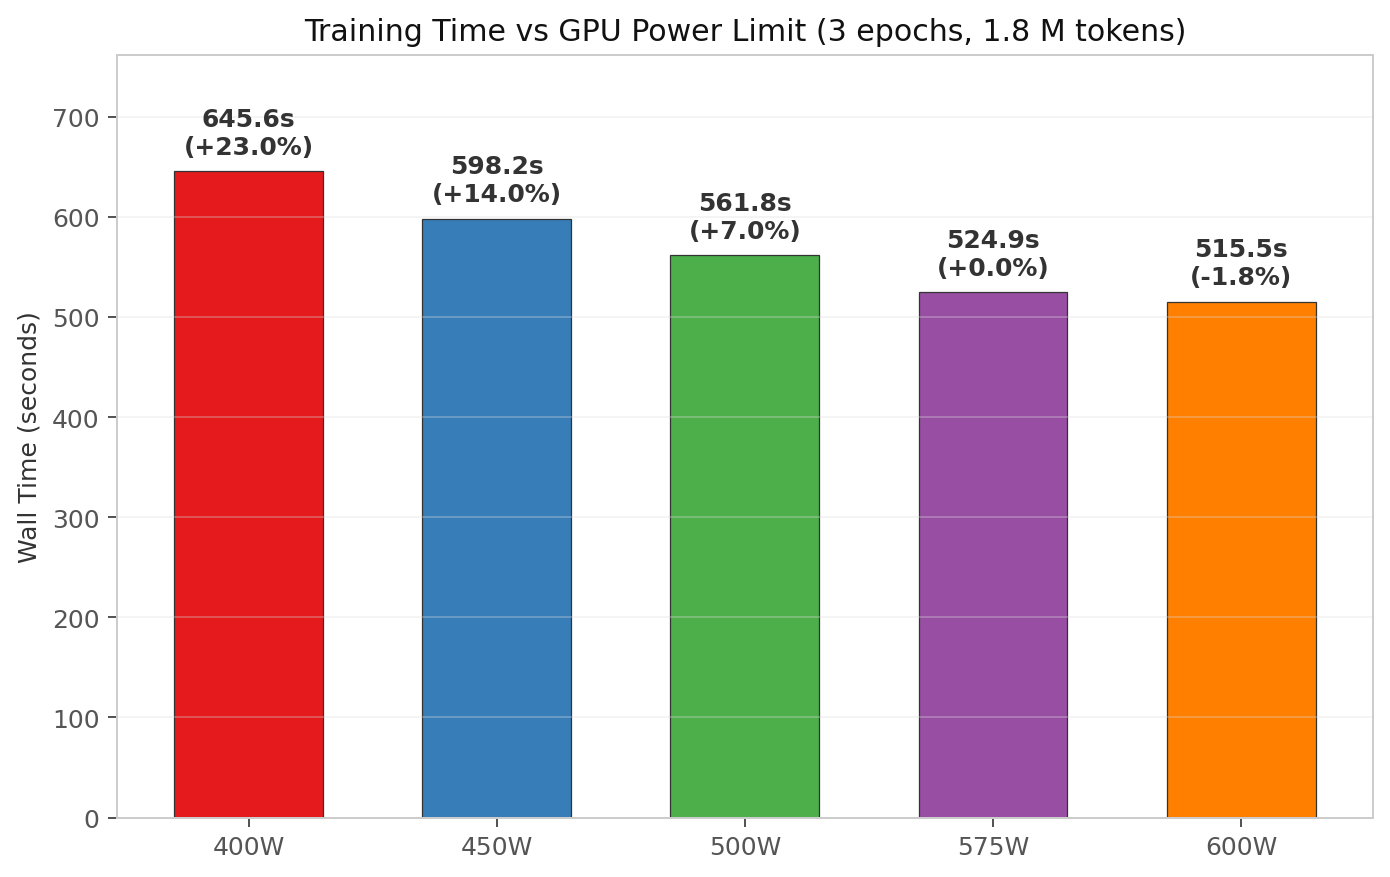
I timed each run from the first training step to the last with Python’s perf_counter(). Then I normalized every result against the 575W baseline.
| Power Limit | Wall Time (3 epochs) | Relative to 575W | Time Added/Saved |
|---|---|---|---|
| 400 W | 645.6 s | 1.23× slower | +121 s |
| 450 W | 598.2 s | 1.14× slower | +73 s |
| 500 W | 561.8 s | 1.07× slower | +37 s |
| 575 W | 524.9 s | 1.00× baseline | — |
| 600 W | 515.5 s | 0.98× as fast | −9 s |
Throughput vs power limit
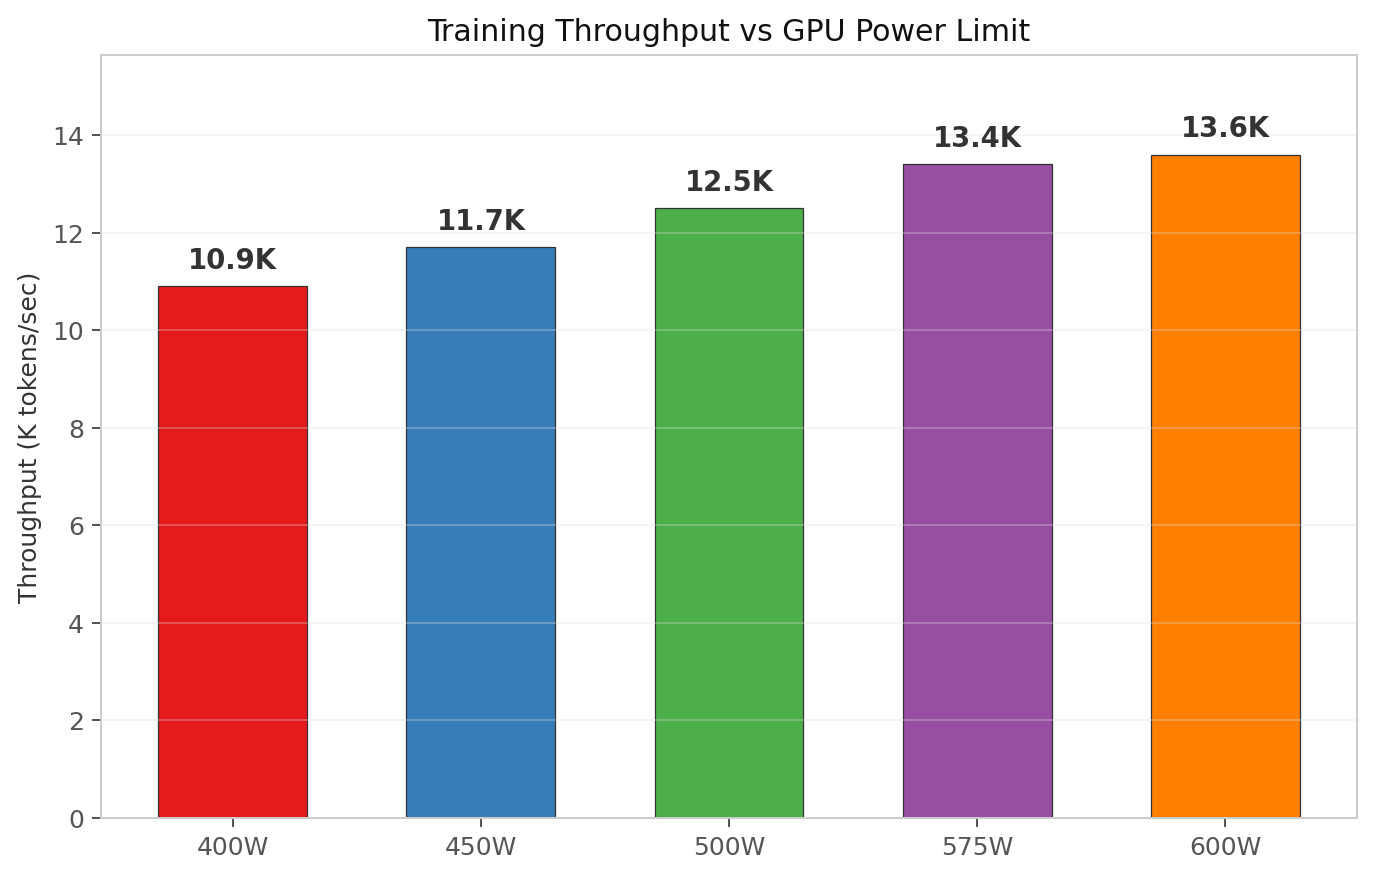
Throughput is the token count divided by elapsed wall time. PyTorch reported tokens processed, and I divided by the same perf_counter interval.
| Power Limit | Tokens/sec | Relative to 575W |
|---|---|---|
| 400 W | 10,900 | 0.81× |
| 450 W | 11,700 | 0.87× |
| 500 W | 12,500 | 0.93× |
| 575 W | 13,400 | 1.00× |
| 600 W | 13,600 | 1.01× |
Energy efficiency (tokens per watt)
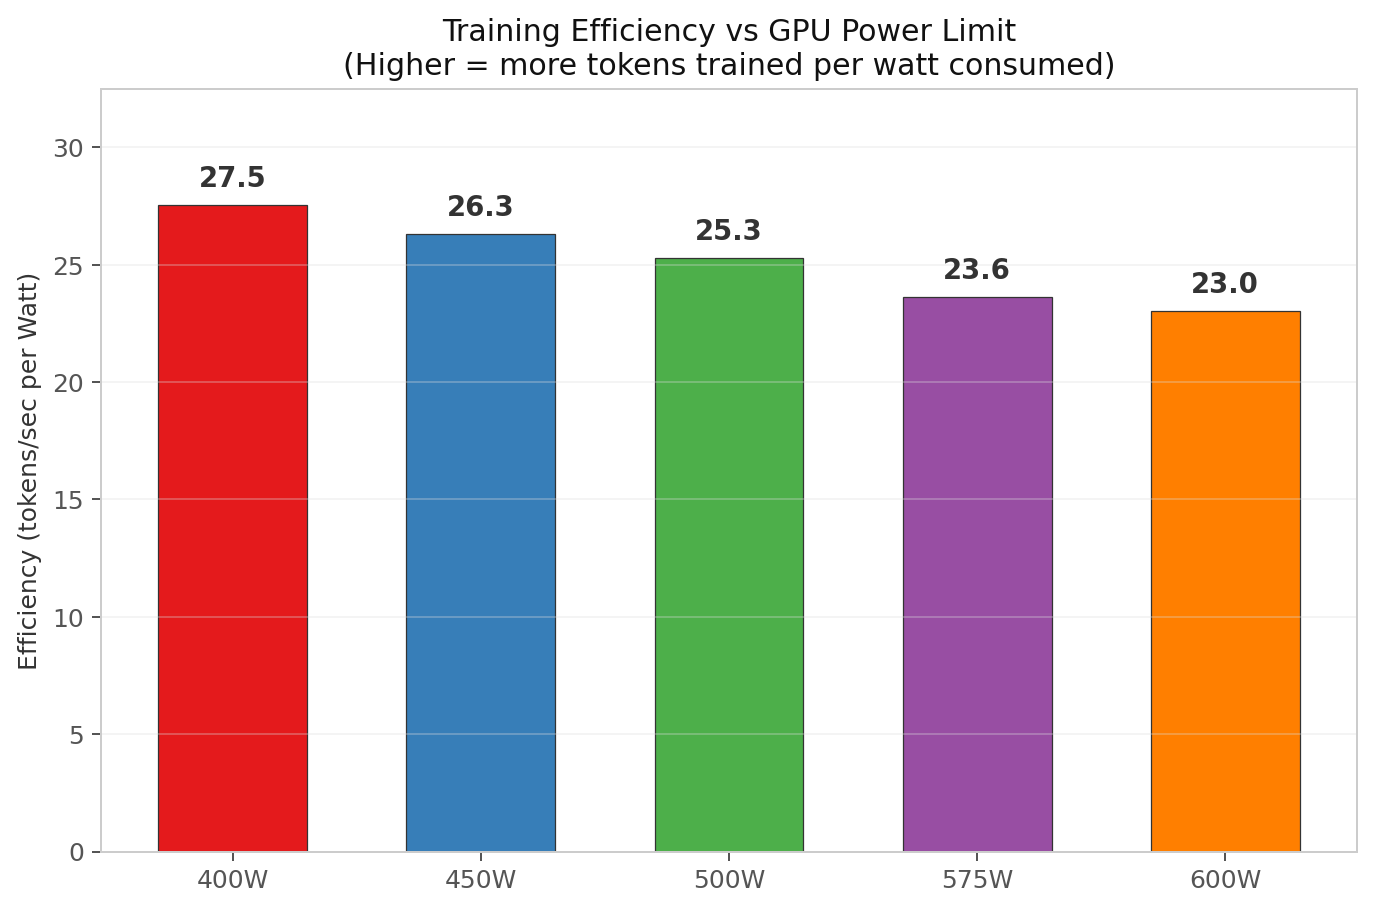
Efficiency comes from throughput divided by average watts. Average watts came from the nvidia-smi dmon log. I divided the raw token rate by the average draw to get tokens per wall-watt.
| Power Limit | Avg Draw | Efficiency (tok/s per W) | Energy per run |
|---|---|---|---|
| 400 W | 396 W | 27.5 | 71.0 Wh |
| 450 W | 445 W | 26.3 | 73.9 Wh |
| 500 W | 494 W | 25.3 | 77.1 Wh |
| 575 W | 567 W | 23.6 | 82.7 Wh |
| 600 W | 591 W | 23.0 | 84.6 Wh |
Total energy consumed per run
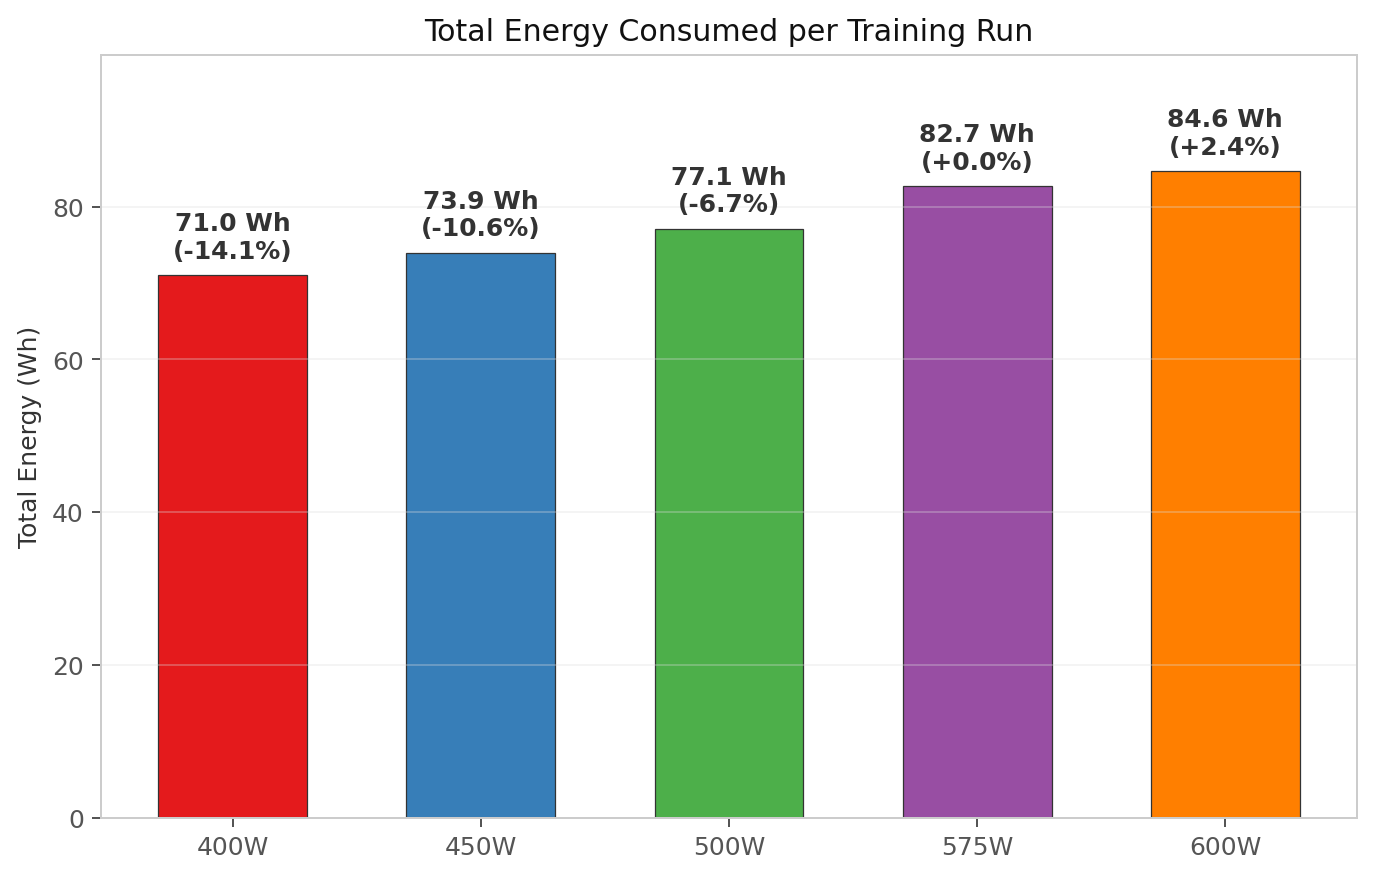
Total energy is average draw multiplied by wall time, converted to watt-hours. I pulled the average wattage from nvidia-smi dmon and multiplied by the elapsed seconds, then divided by 3600.
| Power Limit | Avg Draw | Wall Time | Total Energy | vs 575W |
|---|---|---|---|---|
| 400 W | 396 W | 645.6 s | 71.0 Wh | −14.1% |
| 450 W | 445 W | 598.2 s | 73.9 Wh | −10.6% |
| 500 W | 494 W | 561.8 s | 77.1 Wh | −6.7% |
| 575 W | 567 W | 524.9 s | 82.7 Wh | baseline |
| 600 W | 591 W | 515.5 s | 84.6 Wh | +2.4% |
I used to think lower power limits were a wash — longer runtime would eat the savings. That assumption was wrong.
The 400W run uses 14% less total electricity than 575W for the same three epochs. Static power — the watts the card burns even when not crunching — stays roughly constant, so cutting the dynamic ceiling improves the overall ratio enough to offset the extra minutes.
At full load the difference saves you “nice dinner” money, not “new GPU” money. The more painful issue is heat. Dumping 570W into a bedroom in July turns the room into a sauna and beats on the VRMs — the voltage regulator modules that feed the GPU core.
But this machine is a personal workstation, not a server farm. I modeled a realistic duty cycle of 20% loaded and 80% idle — browsing, SSH remote-terminal sessions, background tasks — at a 40W idle draw. I blended each loaded average with the 40W idle draw at an 80/20 weighting to get the effective average, then converted to euros with the same tariff across all rows. Yearly cost then looks like this:
| Power Limit | Effective Avg Draw | Yearly Cost | Saved vs 575W |
|---|---|---|---|
| 400 W | 111 W | €195 | €60 |
| 450 W | 121 W | €212 | €43 |
| 475 W (interpolated) | ~126 W | ~€221 | ~€34 |
| 500 W | 131 W | €229 | €26 |
| 575 W | 145 W | €255 | — |
| 600 W | 150 W | €263 | −€8 |
When you factor in the 80% idle time, the annual savings shrink. A 400W cap saves about €60 a year versus 575W, while 475W saves roughly €34. That’s one nice dinner.
The idle math is what actually matters for a home box. My workstation spends 80% of its life doing nothing, so aggressive power capping barely moves the yearly bill.
The real win is temperature and noise. Sustained 570W through a residential circuit in summer dumps serious heat into the room and pushes the VRMs harder than necessary.
Speed impact relative to 575W baseline
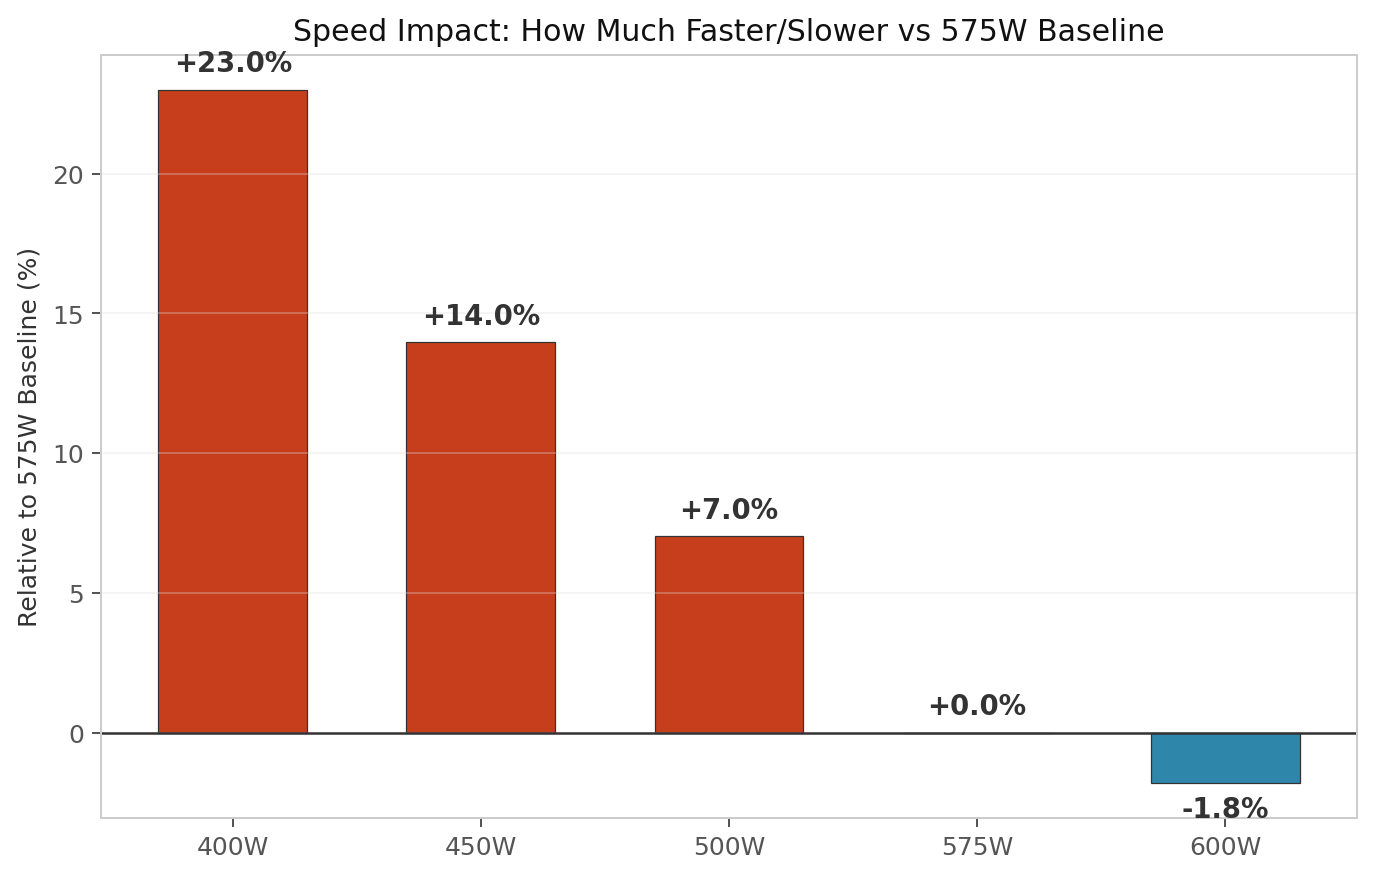
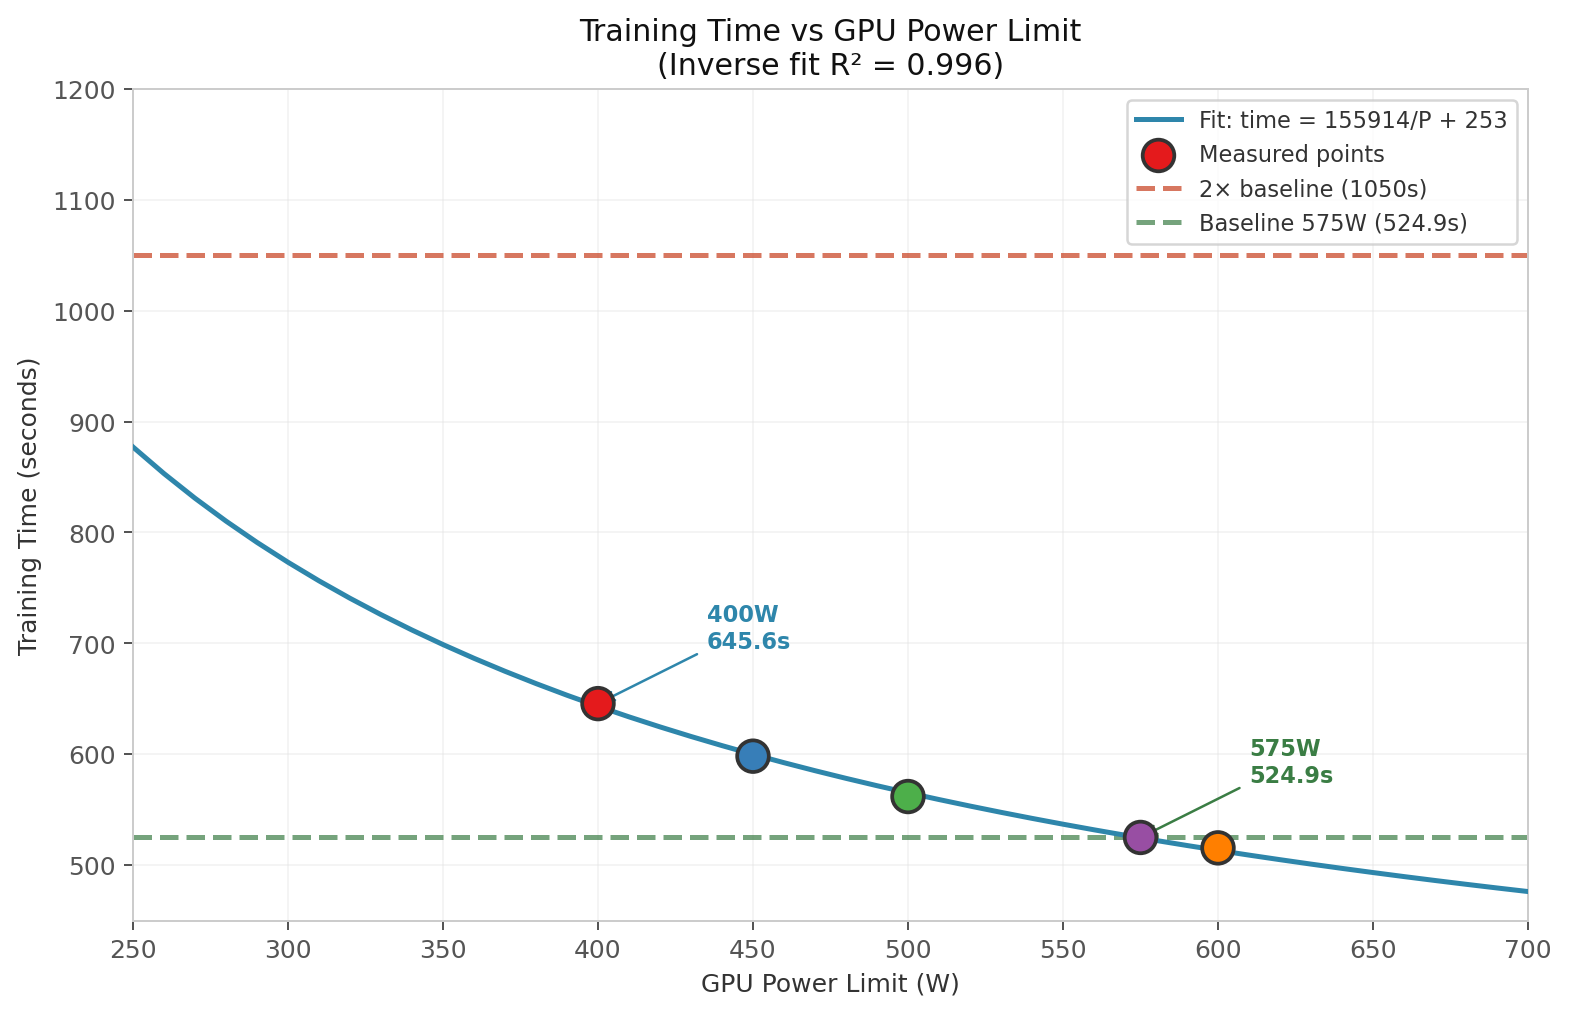
I measured wall time at each cap and fit a curve with ordinary least-squares regression. The relationship is almost perfectly inverse: training time ≈ 155,914/P + 253.4, with an R² of 0.996. That coefficient of determination means the power-to-time model explains 99.6% of the variance in the measured data.
At 200W you’d hit a 1.75× slowdown versus the 575W baseline. At 196W the run doubles. The 400W–600W range looks linear, but once you drop below 400W the fixed overheads — PCIe transfers, CPU coordination, static power — dominate the clock.
Extrapolation: how low before it becomes painful?
My take
Lower TDP saves total energy per unit of work. I measured total energy by multiplying average wall draw from nvidia-smi dmon by elapsed wall time. A 400W-capped run consumed 14% less electricity than a 575W-capped run for the same three epochs of the same model. That result contradicted my expectation that longer runtime would exactly cancel the lower wattage. Static power draw breaks the symmetry — it stays roughly constant, so lowering the cap improves the overall ratio.
Whether that matters for your electricity bill depends on how loaded the GPU is. I modeled a home machine that trains 20% of the time and idles — at 40W draw — the other 80%. Under that profile, the yearly savings versus 575W range from €26 at 500W to €60 at 400W. A 24/7 training farm would see €128–300 per GPU per year, but this box is not a farm.
My recommendation for this exact build is 475W or 500W. I measured a 7% wall-time penalty at 500W and an interpolated ~11% penalty at 475W. Both limits are better compromises than the extremes:
- 400W is too slow for interactive work. The 23% wait is noticeable when iterating.
- 575W is fast but dumps 567W of sustained heat into a residential room. The RM1000e can feed it, but your summer air conditioning and your ears may object.
- 600W is wasteful in every dimension: 2.4% more total energy, 2.4% more heat, and only 1.8% less wall time than 575W.
The fire-safety angle is not paranoia. This is a self-built machine in a house with a remote power switch because crashes happen. Sustained 570W+ through a residential circuit in July is a lot of concentrated heat. Lowering the limit to 475W–500W is a small concession for peace of mind.
I did not measure long-term hardware longevity in this study. Reduced voltage stress on the memory, cooler VRMs, and lower thermal cycling may extend the card’s life, but that is speculation rather than data.
References
- NVIDIA nvidia-smi documentation
- PyTorch training script:
train_addition_llm.py - Raw benchmark data:
results.json - This machine’s full spec and context: see the agent architecture post.
Method Glossary
| Term | What it means |
|---|---|
| TDP | Thermal design power — the sustained wattage a cooler is certified to handle under normal operation. |
| nvidia-smi | NVIDIA’s command-line tool for setting power limits and reading GPU telemetry. |
| nvidia-smi dmon | The per-second monitoring mode that prints live power and utilization metrics. |
| decoder-only transformer | A neural architecture built from stacked self-attention layers that predicts the next token. |
| AdamW | An optimizer that decouples weight decay from the gradient update step. |
| R² | The coefficient of determination — how well the power-to-time curve fits the measured points. |