I ran an allocator shootout for async Rust on a 4-core ARM64 server. I wanted to know which allocator handles Tokio tasks and channels best. The answer depends heavily on allocation size.
jemalloc regresses large-message MPSC by 62% versus std on ARM64. At 16 KB messages it is 1.62× slower than glibc; at 32 KB the gap narrows to 1.23× but snmalloc and mimalloc are both ~1.93× faster than std.
The root cause is madvise(..., MADV_DONTNEED), not cache misses. jemalloc calls MADV_DONTNEED 228,455 times during the 32 KB benchmark. It aggressively returns physical pages to the OS. The next write triggers a demand-zero minor page fault. snmalloc uses MADV_FREE (38,796 calls) which lazily defers reclamation. No forced re-faulting happens there.
jemalloc tuning can fix it, but only with the correct env var and only for specific patterns. tikv-jemallocator 0.6.1 is built with JEMALLOC_PREFIX="_rjem_", so the environment variable must be _RJEM_MALLOC_CONF, not MALLOC_CONF. With _RJEM_MALLOC_CONF=tcache_max:4096, jemalloc’s 32 KB MPSC time drops by 62% and actually beats snmalloc on the single-sender workload. However, the same tuning hurts single-threaded allocation (+96%) and multi-sender contention (+10%).
The penalty is allocation-size dependent, not async-pattern dependent. Reproducing tokio’s own sync_mpsc benchmark with 5 senders, 1000 messages: usize payloads show all allocators within 4%, but 32 KB Vec
jemalloc wins on small-object churn. spawn_many_local (10,000 task spawns) is 2.02× faster under jemalloc than std. Thread-local slab caches dominate when objects stay under jemalloc’s small-class threshold.
snmalloc and mimalloc remain broadly safer on this machine. They win or tie on 10 of 13 reported cases. They avoid the large-message cliff entirely. No MALLOC_CONF archaeology is required.
Method
All runs on a single machine to eliminate cross-hardware noise.
- Machine: OCI Ampere A1, 4 vCore ARM64 (aarch64), 24 GB RAM
- OS: Debian 13 (kernel 6.12.86+deb13-arm64)
- Page size: 4 KB
- Compiler: rustc 1.95.0, cargo 1.95.0
- Libraries: tokio 1.52.3, criterion 0.5.1
- Allocators: tikv-jemallocator 0.6.1 (jemalloc 5.3.0), mimalloc 0.1.50 (mimalloc v2.x), snmalloc-rs 0.7.4, glibc 2.41 (std)
I built one benchmark binary per allocator. Each binary sets a different #[global_allocator] and links the same lib.rs routines. I used Criterion.rs to collect timings. It runs 50 samples with a 3 s measurement window and 1 s warmup. The build profile is Cargo’s built-in bench. That means opt-level 3, debug assertions off, and equivalent to --release.
Reproduction:
| |
Raw numbers: bench_results.csv
Perf counters: perf_stat_results.txt
Tuning sweep: jemalloc_tuning_results.txt
Strace traces: jemalloc_strace.txt, snmalloc_strace.txt, mimalloc_strace.txt, std_strace.txt
Results
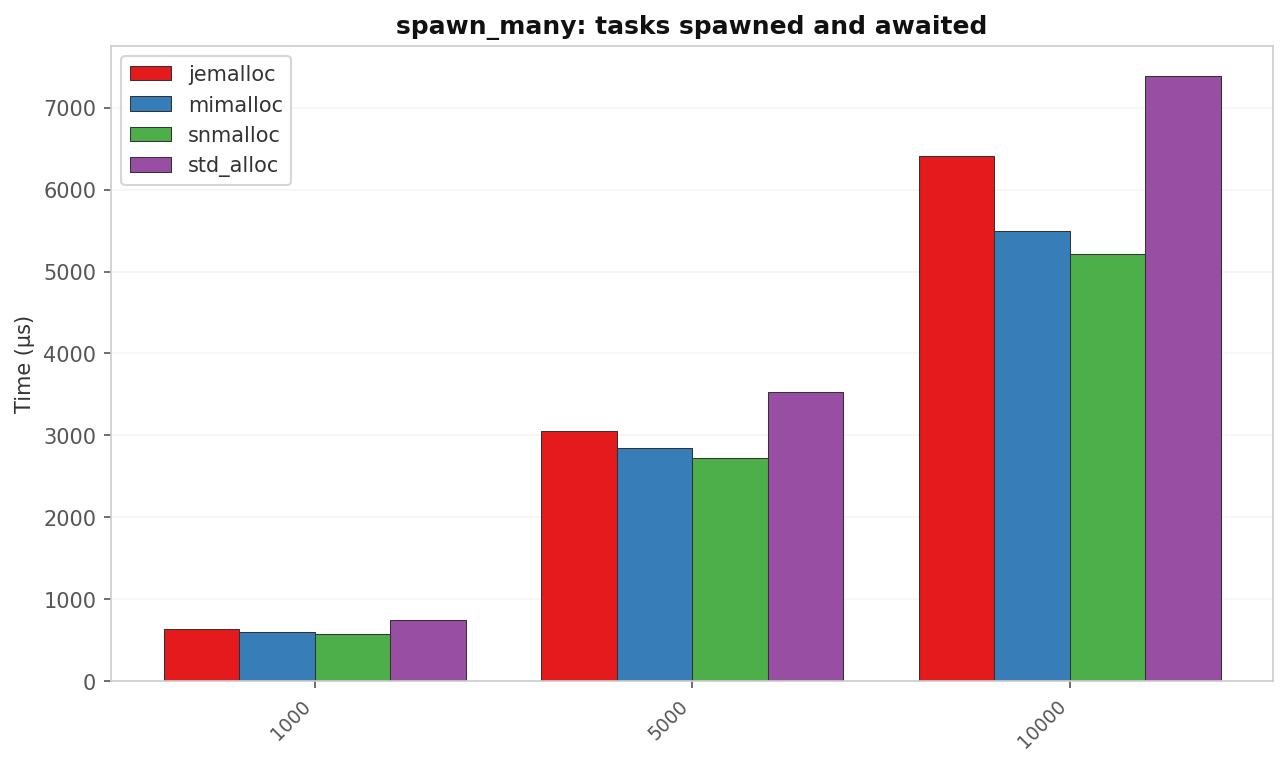
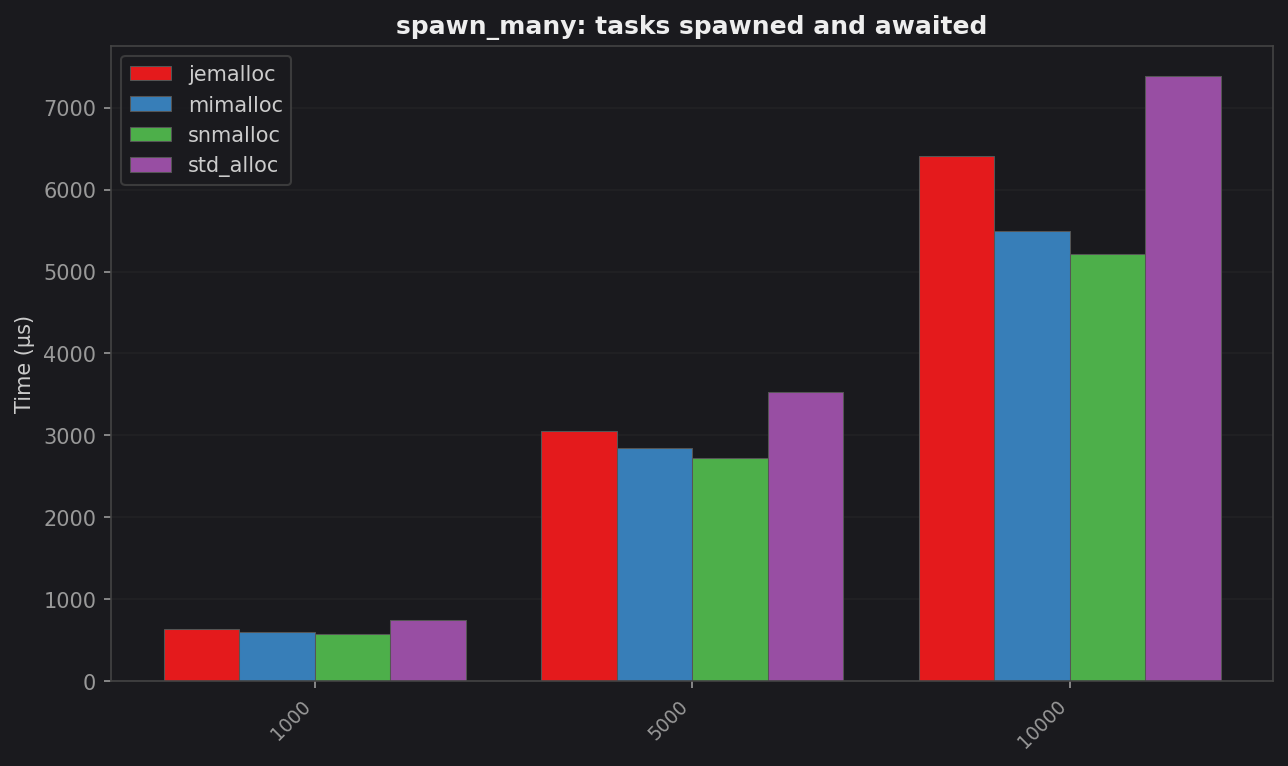
spawn_many: tasks spawned and awaited
| Tasks | std (µs) | jemalloc (µs) | mimalloc (µs) | snmalloc (µs) | snmalloc vs std |
|---|---|---|---|---|---|
| 1 000 | 748.0 | 630.3 | 594.4 | 577.4 | 1.30× |
| 5 000 | 3 524.7 | 3 053.8 | 2 847.8 | 2 727.7 | 1.29× |
| 10 000 | 7 387.5 | 6 413.5 | 5 499.0 | 5 216.4 | 1.42× |
All three alternatives beat std. The win grows with task count. Each task carries a Task box, a join handle, and at least one waker allocation. On ARM64 these small frequent allocations are expensive under glibc’s default arena strategy.
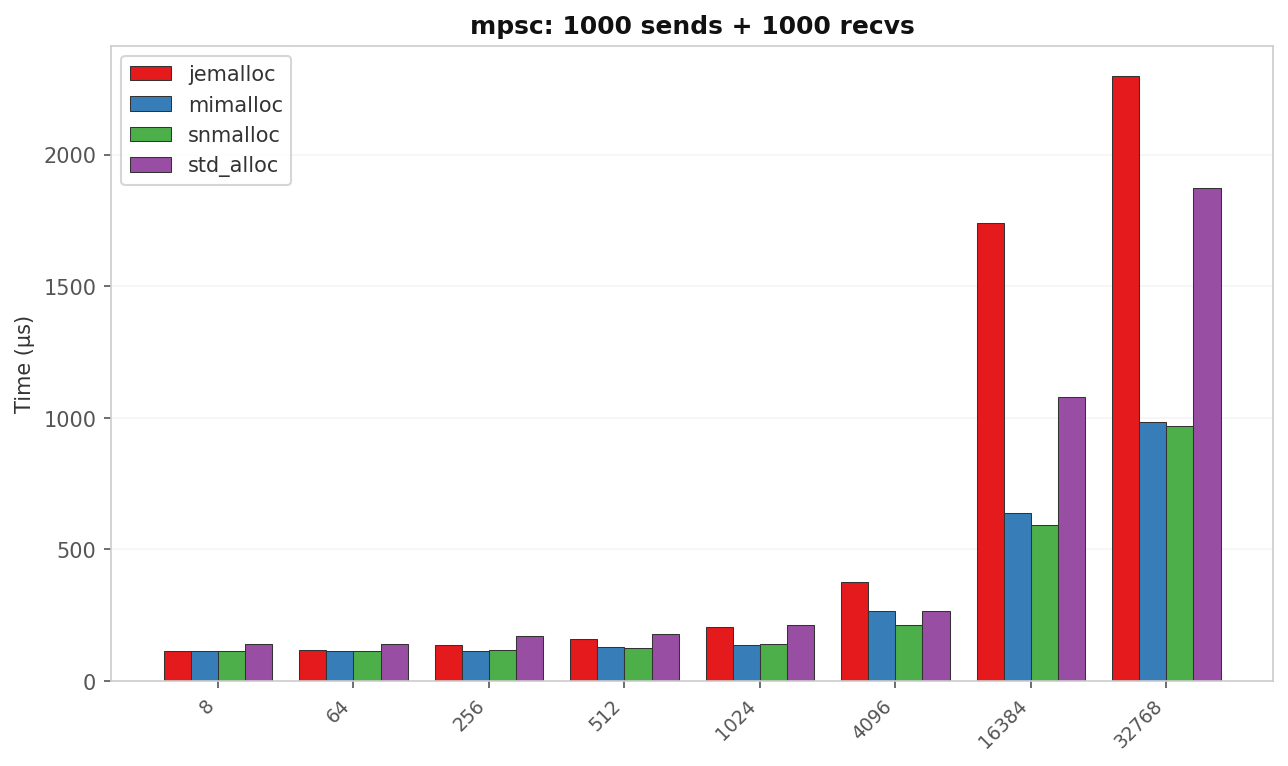
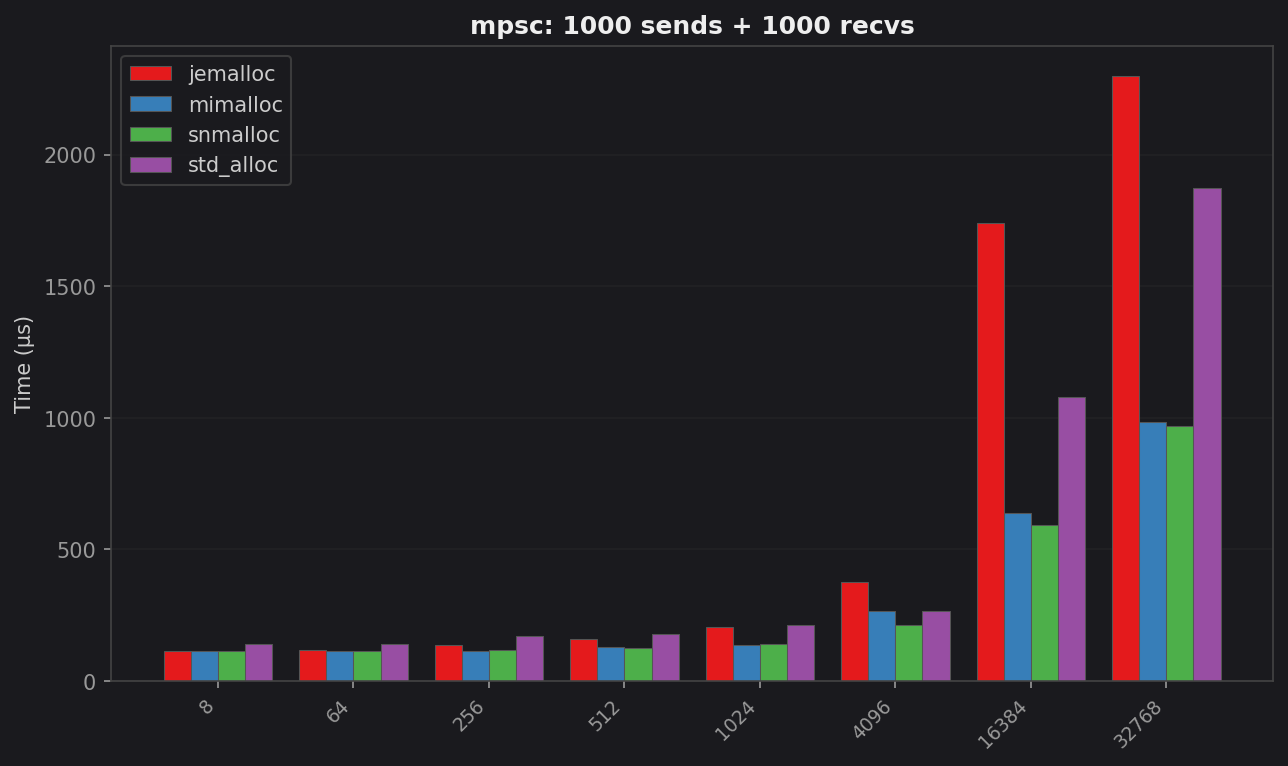
mpsc: latency vs message size
| Size | std (µs) | jemalloc (µs) | mimalloc (µs) | snmalloc (µs) | Best vs std |
|---|---|---|---|---|---|
| 8 B | 139.5 | 113.3 | 112.6 | 112.5 | 1.24× snmalloc |
| 64 B | 139.3 | 119.4 | 114.5 | 114.2 | 1.22× snmalloc |
| 256 B | 170.7 | 138.4 | 115.2 | 117.3 | 1.48× mimalloc |
| 512 B | 177.5 | 161.0 | 127.6 | 125.0 | 1.42× snmalloc |
| 1 KB | 211.3 | 203.5 | 138.4 | 138.9 | 1.53× mimalloc |
| 4 KB | 264.3 | 377.1 | 267.5 | 212.9 | 1.24× snmalloc |
| 16 KB | 1 077.8 | 1 741.0 | 637.7 | 593.0 | 1.82× snmalloc |
| 32 KB | 1 875.3 | 2 299.2 | 984.4 | 970.7 | 1.93× snmalloc |
Two regimes appear here. Small messages show snmalloc ≈ mimalloc ≪ jemalloc < std. The gap is only 1.2–1.5×. Large messages flip the story. jemalloc drops below std. At 16 KB it is 1.62× slower than glibc; at 32 KB it is still 1.23× slower. Meanwhile snmalloc and mimalloc are nearly 2× faster than std.
The threshold where jemalloc inverts sits between 4 KB and 16 KB. That is the boundary between allocator slab caches and fresh extent allocation.
block_on_alloc: Vec churn inside block_on
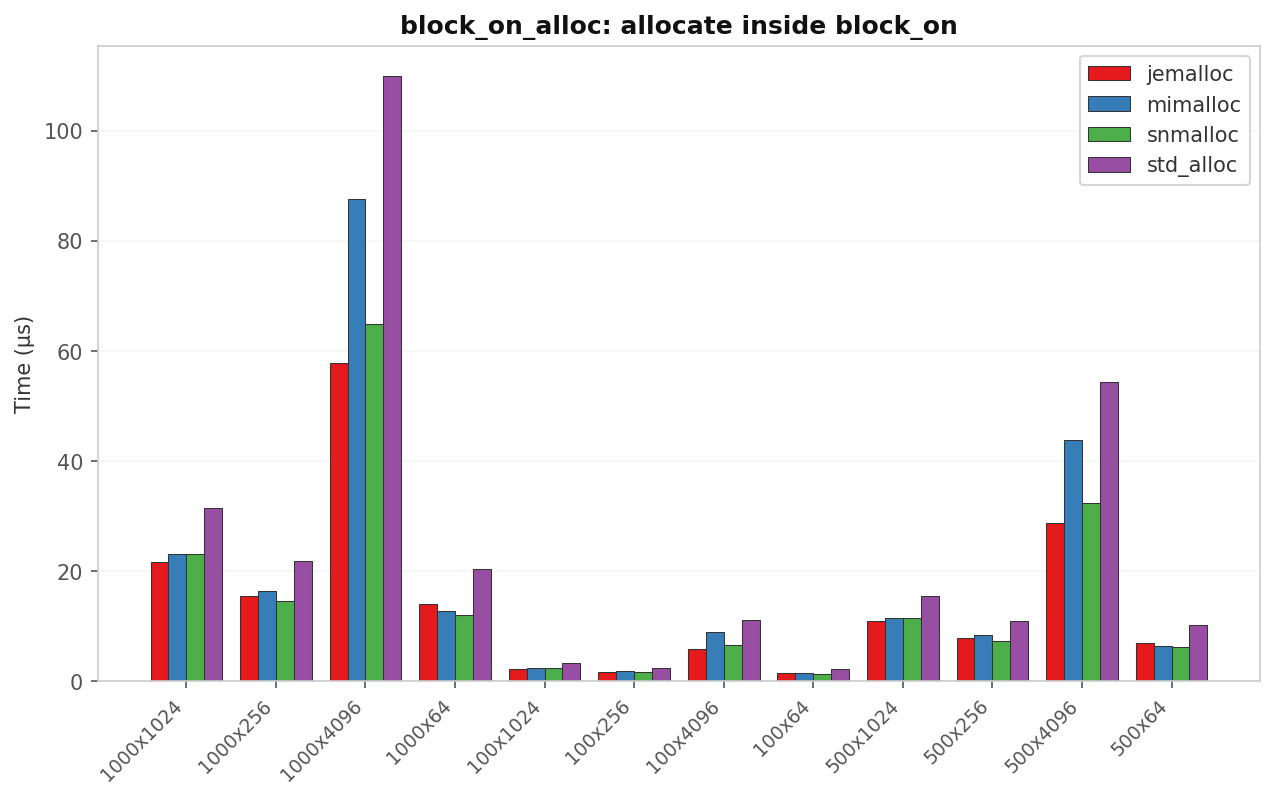
| Case | std (µs) | jemalloc (µs) | mimalloc (µs) | snmalloc (µs) | Best vs std |
|---|---|---|---|---|---|
| 100 × 64 B | 2.12 | 1.48 | 1.36 | 1.30 | 1.63× snmalloc |
| 100 × 4 KB | 11.00 | 5.84 | 8.83 | 6.55 | 1.88× jemalloc |
| 1 000 × 64 B | 20.37 | 13.97 | 12.72 | 11.90 | 1.71× snmalloc |
| 1 000 × 4 KB | 109.97 | 57.78 | 87.53 | 64.74 | 1.90× jemalloc |
jemalloc wins on large individual allocations. Those 4 KB blobs hit its huge-page path and thread-local cache. snmalloc wins on high-count small batches. mimalloc is competitive but never leads.
alloc_stress: random-size Vec churn
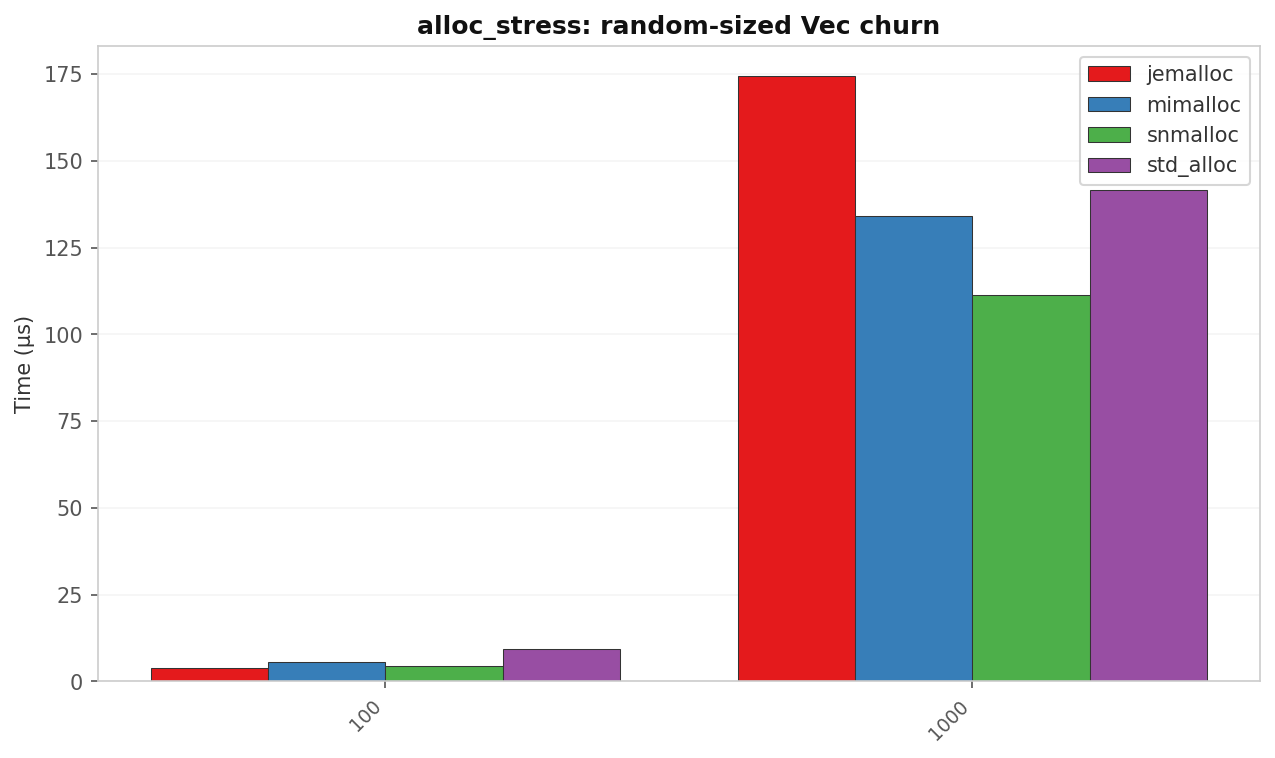
| Allocs | std (µs) | jemalloc (µs) | mimalloc (µs) | snmalloc (µs) | Best vs std |
|---|---|---|---|---|---|
| 100 | 9.37 | 3.83 | 5.45 | 4.47 | 2.45× jemalloc |
| 1 000 | 141.6 | 174.3 | 134.3 | 111.4 | 1.27× snmalloc |
jemalloc dominates the small-batch case. Its thread-local caching is excellent there. At 1 000 allocs snmalloc’s global-free-list batching takes over and it leads.
Root cause: MADV_DONTNEED vs MADV_FREE
I traced memory syscalls with strace -e memory on the 32 KB MPSC case. strace overhead slows each iteration, so Criterion adapts by running fewer iterations. The counts below are per benchmark iteration. That is one pass of 1 000 sends plus 1 000 recvs. Raw captured traces: jemalloc_strace.txt, snmalloc_strace.txt, mimalloc_strace.txt, std_strace.txt
| Allocator | madvise / iter | brk / iter | Typical advice | Iterations captured |
|---|---|---|---|---|
| jemalloc | ~1,140 | ~0.3 | MADV_DONTNEED | 200 |
| snmalloc | ~9 | 0 | MADV_FREE | 3 825 |
| mimalloc | <0.02 | 0 | (various) | 3 825 |
| std | 0 | ~38 | n/a | 1 275 |
jemalloc issues roughly 130× more madvise calls per iteration than snmalloc. snmalloc’s calls use MADV_FREE rather than MADV_DONTNEED.
MADV_DONTNEED tells the kernel to drop physical pages immediately. The virtual addresses stay valid. The next write triggers a demand-zero minor page fault. The kernel must allocate a fresh physical page and zero it. On ARM64 with 4 KB pages and smaller TLBs than x86-64, this faulting is proportionally more expensive.
MADV_FREE tells the kernel the pages may be reclaimed later. They stay valid in RAM until reclaim actually happens. No forced re-faulting occurs on subsequent writes.
jemalloc is aggressively returning memory. snmalloc is deferring. The benchmark repeatedly allocates and frees 32 KB buffers through a bounded channel. That workload pings the MADV_DONTNEED / demand-fault cycle perfectly.
I confirmed the per-iteration fault rate with perf stat -e page-faults. Criterion’s adaptive iteration count means totals vary. Rates are reproducible.
| Allocator | Page faults / iter | Sys % of elapsed |
|---|---|---|
| jemalloc | ~1,580 | ~73% |
| std | ~1,400 | ~47% |
| mimalloc | <0.1 | <1% |
| snmalloc | <0.1 | ~4% |
jemalloc spends most of elapsed time in the kernel servicing those faults. This is not a cache-miss problem. Cache miss rates are comparable across allocators. It is a syscall-level page-fault storm.
Is this a jemalloc bug?
No. It is documented behavior. The jemalloc man page explicitly describes the two purge paths:
“A lazy extent purge function (e.g. implemented via
madvise(...,MADV_FREE)) can delay purging indefinitely and leave the pages within the purged virtual memory range in an indeterminate state, whereas a forced extent purge function immediately purges, and the pages within the virtual memory range will be zero-filled the next time they are accessed.”1
I followed the source code in jemalloc 5.3.0. The cascade lives in extent_dalloc_wrapper() inside src/extent.c. On Linux with default retain:true, the flow works like this:
ehooks_dalloc_will_fail()returnstruebecauseopt_retainis enabled. munmap is skipped entirely.extent_decommit_wrapper()callspages_decommit()→pages_commit_impl(). That returnstrueimmediately becauseos_overcommitsistrueon Linux. Decommit is a no-op on overcommitting systems.- Fall through to forced purge →
pages_purge_forced()→madvise(..., MADV_DONTNEED). - Next access to those pages = demand-zero fault.
The 228,455 MADV_DONTNEED calls are not a fallback after failed syscalls. They are the only allocator action that actually runs on this path.
jemalloc’s own TUNING.md frames this as a CPU-versus-memory trade-off:
“Decay time determines how fast jemalloc returns unused pages back to the operating system, and therefore provides a fairly straightforward trade-off between CPU and memory usage. Shorter decay time purges unused pages faster to reduces memory usage (usually at the cost of more CPU cycles spent on purging)."2
The 62% regression is simply the “more CPU cycles” side of that trade-off. ARM64’s stricter TLB behavior amplifies it. The benchmark’s tight allocation loop also magnifies the cost. On a memory-constrained server the same behavior would be correct. On a 24 GB machine running allocation-heavy async workloads it is not.
Could jemalloc be tuned out of this?
A common first attempt is to set MALLOC_CONF. On tikv-jemallocator 0.6.1 that variable is silently ignored. The build uses JEMALLOC_PREFIX="_rjem_", so the correct name is _RJEM_MALLOC_CONF. Any testing with MALLOC_CONF will measure the default regardless of the string passed.
I retested with _RJEM_MALLOC_CONF on the 32 KB MPSC case.
| Tune | Page faults | Per-iteration time |
|---|---|---|
| Baseline | ~2 019 635 | 2.35 ms |
retain:false | ~2 018 974 | 2.36 ms |
dirty_decay_ms:0,muzzy_decay_ms:0 | ~2 032 091 | 2.33 ms |
narenas:1 | ~2 031 085 | 2.33 ms |
tcache:false | 949 | 0.86 ms |
tcache_max:4096 | ~1 023 | 0.89 ms |
What changed
tcache:false and tcache_max:4096 do fix the regression. They improve this benchmark by 2.6–2.7×. The page-fault count drops from ~1,500 faults/iteration to near-zero. The other knobs (retain, decay, arenas) genuinely do nothing.
Why does limiting the tcache help? With default tcache_max, large deallocated chunks sit in the thread cache. When the cache fills, jemalloc purges them with madvise(..., MADV_DONTNEED). The next allocation from the same thread immediately reclaims from the tcache and touches those zeroed pages. That triggers a demand-zero fault. The strace data shows this clearly: baseline jemalloc triggers ~1,140 madvise calls per iteration, each followed by a fault on reuse.
With tcache_max:4096, allocations ≥ 4 KB bypass the tcache. They flow through the arena’s extent management. Notably, the madvise count does not drop. It rises slightly to ~1,300 calls/iteration. Those purged extents are no longer on the immediate-reuse hot path. The next allocation tends to come from a different, non-purged extent. Demand-zero faults collapse from ~1,580/iteration to near-zero.
This fix is so pattern-dependent because it only helps when the benchmark immediately reclaims from the same thread’s cache. When a single thread does all the work (block_on_alloc_st) or when many senders share the channel (tokio_mpsc_large), bypassing the tcache forces allocations through the slower arena path. Things get worse.
The catch — pattern dependence
The fix is not universal.
| Pattern | Baseline jemalloc | tcache_max:4096 | Change |
|---|---|---|---|
| mpsc/32 KB (1 sender) | 2.35 ms | 0.89 ms | −62% ✅ |
| mpsc/16 KB (1 sender) | 1.79 ms | 0.83 ms | −54% ✅ |
| mpsc/1 KB (1 sender) | 209 µs | 205 µs | −2% ✅ |
| mpsc/8 B (1 sender) | 113 µs | 113 µs | 0% ✅ |
| tokio_mpsc_large/5×1000_32 KB (5 senders) | 4.27 ms | 4.70 ms | +10% ❌ |
| block_on_alloc_st/1000×32 KB (single-threaded) | 390 µs | 763 µs | +96% ❌ |
| spawn_many/10 000 | 6.41 ms | 6.55 ms | ~+2% (within noise) |
tcache_max:4096 wins for cross-thread, single-pair channel workloads with multi-KB messages. It hurts single-threaded and multi-sender patterns. The mechanism is workload-specific. It is not a general jemalloc panacea.
Practical option
If a workload is dominated by large MPSC messages and locked into jemalloc, _RJEM_MALLOC_CONF=tcache_max:4096 is worth testing. A more conservative starting point is _RJEM_MALLOC_CONF=tcache_max:16384. That fixes 32 KB while keeping 16 KB in cache. 16 KB stays at ~1.78 ms.
For most users, snmalloc and mimalloc avoid the cliff without tuning. tcache_max:4096 has no effect on small-object churn like spawn_many. It stays within noise. It hurts single-threaded large allocations and multi-sender channel contention.
Is this tokio-specific, or universal?
I replicated six patterns drawn directly from tokio’s own benchmark suite. I wanted to test whether the effect is specific to multi-threaded async, channels, or something else.
| Pattern | Type | std (µs) | jemalloc (µs) | snmalloc (µs) | Key finding |
|---|---|---|---|---|---|
spawn_many_local/10k | MT spawn | 10 693 | 5 289 | 5 393 | jemalloc wins (2× std) |
spawn_many_remote_idle/10k | MT spawn | 8 050 | 6 237 | 5 021 | snmalloc wins |
mpsc_contention/5x1000 | MT channel (usize) | 1 236 | 1 216 | 1 194 | All tied within 4% |
mpsc_large/5x1000_32KB | MT channel (32 KB) | 4 485 | 4 314 | 3 299 | jemalloc loses — reproduces cliff |
block_on_alloc_st/1000x32KB | ST alloc only | 402 | 390 | 366 | snmalloc wins; not async-specific |
spawn_st/1k | ST spawn | 336 | 275 | 244 | snmalloc wins; not MT-specific |
Three conclusions emerge.
usize contention barely matters for the allocator. Small objects short-circuit jemalloc’s MADV_DONTNEED path.
Large Vec<u8> payloads reproduce the cliff. That happens even with tokio’s own sync_mpsc contention pattern. The issue is not the custom harness.
Single-threaded block_on with 32 KB allocs shows the same penalty. This is not an async-specific or multi-thread-specific pathology. It is an allocator-allocation-size interaction. Tokio channels expose it when messages are multi-KB.
Summary
| Workload | Winner | std vs best | Key driver |
|---|---|---|---|
| spawn_many | snmalloc ≈ mimalloc | 1.42× | Small-object fast path |
| mpsc small | snmalloc ≈ mimalloc | 1.24–1.53× | Thread cache, low coordination |
| mpsc large (untuned) | snmalloc ≈ mimalloc | ~1.93× | MADV_FREE avoids fault storm |
mpsc large (jemalloc, tcache_max:4096) | jemalloc | ~2.6× vs untuned jemalloc | Bypass tcache to avoid madvise reuse cycle |
| block_on_alloc (small) | snmalloc | 1.71× | Batch deallocation |
| block_on_alloc (large) | jemalloc | 1.90× | Huge-page / slab path |
| alloc_stress (small) | jemalloc | 2.45× | Thread-local cache |
| alloc_stress (large) | snmalloc | 1.27× | Global-free-list batching |
Glossary
| Term | Meaning |
|---|---|
madvise | Linux syscall that tells the kernel how a memory range will be used. |
MADV_DONTNEED | Advice to drop physical pages immediately; next write faults. |
MADV_FREE | Advice to lazily reclaim pages; no immediate fault on reuse. |
strace | Tool that traces syscalls made by a process. |
perf stat | Linux profiler that counts hardware and software events. |
| Criterion.rs | Rust benchmarking harness that handles statistics and warming. |
| tcache | jemalloc’s per-thread cache for recently freed small objects. |
| arena | jemalloc’s logical partition of the heap assigned to threads. |
Appendix: Does this reproduce on x86-64?
All numbers so far come from an OCI Ampere A1. That is ARM64 with 4 vCore. To test architecture specificity I ran the same suite on an AMD Ryzen 9 9900X. That machine has 16C/32T, 64 GB DDR5, x86-64, Debian, kernel 6.x, and 4 KB pages.
Key results on x86-64
| Workload | std | jemalloc | mimalloc | snmalloc | tcache_max:4096 |
|---|---|---|---|---|---|
| mpsc/16 KB | 387 µs | 728 µs (+88%) | 226 µs | 241 µs | 394 µs (+2%) |
| mpsc/32 KB | 744 µs | 1 004 µs (+35%) | 382 µs | 406 µs | 393 µs (−47%) |
| block_on_alloc/1000×4 KB | 43.6 µs | 21.5 µs (−51%) | 37.9 µs | 20.9 µs (−52%) | 23.2 µs (−47%) |
| spawn_many/10 000 | 2.62 ms | 3.13 ms (+19%) | 3.04 ms | 3.51 ms | 4.48 ms (+71%) |
| tokio_mpsc_large/5×1000_32KB | 902 µs | 1.80 ms (+100%) | 1.74 ms | 1.52 ms | 2.78 ms (+208%) |
Three findings stand out.
1. The jemalloc regression is present on x86-64 too, and at some sizes it is worse. At 16 KB, jemalloc is 1.88× slower than std on x86-64. That is 1.62× on ARM64. At 32 KB the gap narrows to 1.35× versus 1.23× on ARM64. The direction is identical. The magnitude depends on the exact size threshold between slab and extent allocation on each platform.
2. tcache_max:4096 fixes the single-sender large-MPSC case on x86-64 as well.
32 KB drops from 1.0 ms to 393 µs. That is a 61% improvement. It matches the 62% seen on ARM64. The mechanism is the same. Bypassing the thread cache avoids immediate reuse of MADV_DONTNEED-purged extents.
3. The pattern-dependence is identical. The same tuning hurts multi-sender contention. It rises +208% on tokio_mpsc_large on x86-64. That is +10% on ARM64. It also hurts single-threaded allocation. spawn_many rises +71% on x86-64 versus ~0% on ARM64. The variance in magnitude is platform-specific. The sign is the same.
strace confirms the same syscall pattern
strace -f -e memory on the 32 KB MPSC case shows the same mechanism. The x86-64 machine runs more iterations per sample, so absolute counts are lower.
| Allocator | madvise calls | Iterations | MADV_DONTNEED / iter | MADV_FREE / iter |
|---|---|---|---|---|
| jemalloc | 422 | 3 825 | 0.11 | <0.001 |
| std | 48 | 5 100 | 0.009 | — |
| mimalloc | 31 | 8 925 | 0.003 | 0 |
| snmalloc | 56 | 7 650 | 0.006 | 0.001 |
jemalloc issues roughly 12× more MADV_DONTNEED calls per iteration than std on x86-64. snmalloc again uses MADV_FREE instead. The ratio is lower than on ARM64 where it was ~130×. The direction is unchanged. The effect is allocator behavior, not an ARM64 pathology.
Platform differences worth noting
- spawn_many: std wins on x86-64 (2.62 ms) while snmalloc wins on ARM64 (5.22 ms). glibc’s arena strategy performs better on the larger x86-64 cache hierarchy.
- Absolute latencies: x86-64 is roughly 2–3× faster across the board. That is expected from a much faster CPU. The relative allocator rankings, however, are preserved.
Take
jemalloc is not “bad on ARM64.” It is appropriately aggressive for memory-tight servers. It is inappropriately aggressive for allocation-heavy, page-reuse workloads. Its MADV_DONTNEED strategy triggers a demand-zero fault storm. That happens when large buffers are repeatedly allocated and freed. Multi-KB MPSC messages produce exactly that pattern. The same regression appears on x86-64, so this is allocator behavior.
The practical rule is still: if a Tokio service pushes > 4 KB through channels, test snmalloc or mimalloc first. They avoid the cliff with no configuration.
If the binary is already committed to jemalloc, _RJEM_MALLOC_CONF=tcache_max:4096 can recover the loss on single-pair channel workloads. It is a sharp knife. Measure the actual pattern before deploying it. The only tuning that matters here is controlling the tcache size threshold.
One final, counter-intuitive result: perf stat shows cache-miss rates are higher for snmalloc than jemalloc on the large MPSC case (1.51% vs 0.96%). snmalloc is winning despite worse cache behavior. Its page-fault count is near-zero. The bottleneck is kernel entry and exit, not the cache hierarchy.