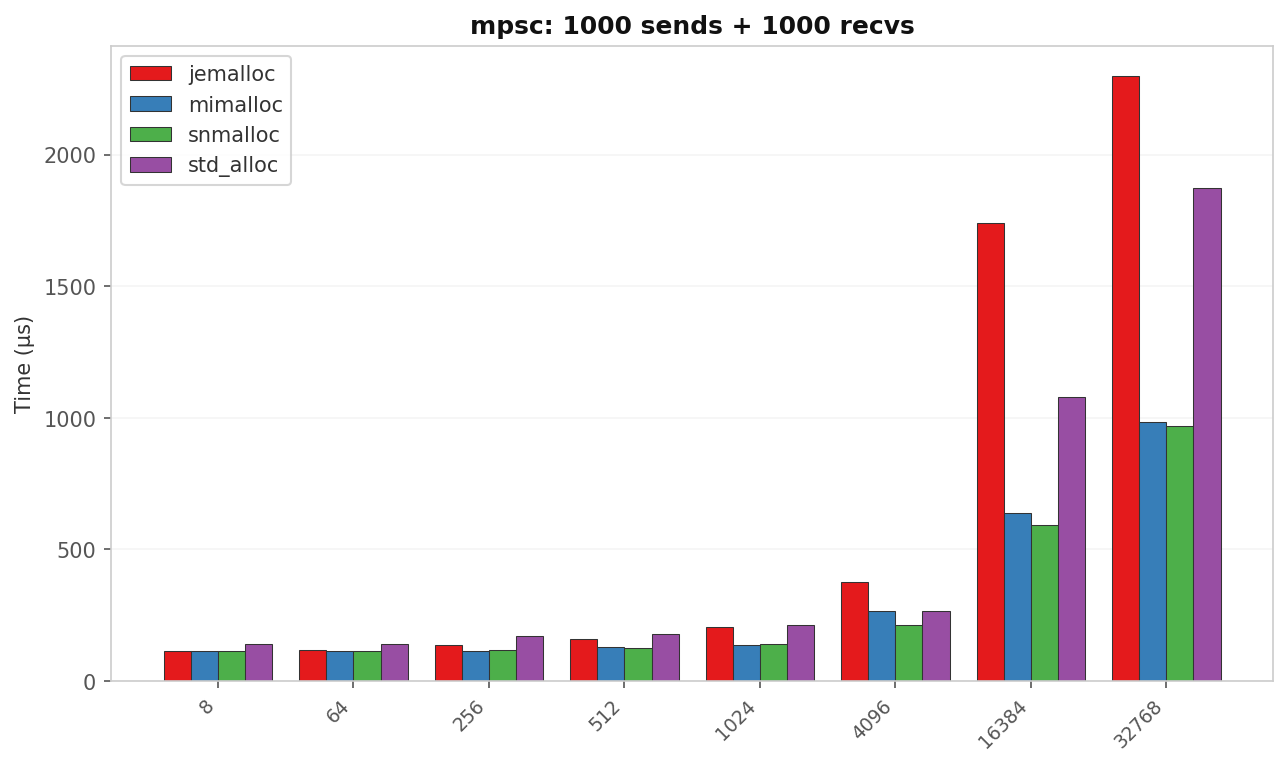
- jemalloc regresses large-message MPSC by 62% versus std on ARM64. At 16 KB messages it is 1.62× slower than glibc; at 32 KB the gap narrows to 1.23× but snmalloc and mimalloc are both ~1.93× faster than std.
- The root cause is
madvise(..., MADV_DONTNEED), not cache misses. jemalloc callsMADV_DONTNEED228,455 times during the 32 KB benchmark, aggressively returning physical pages to the OS. The next write to any returned page triggers a demand-zero minor page fault. snmalloc usesMADV_FREE(38,796 calls) which lazily defers reclamation — no forced re-faulting. - jemalloc tuning can fix it, but only with the correct env var and only for specific patterns.
tikv-jemallocator0.6.1 is built withJEMALLOC_PREFIX="_rjem_", so the environment variable must be_RJEM_MALLOC_CONF, notMALLOC_CONF. With_RJEM_MALLOC_CONF=tcache_max:4096, jemalloc’s 32 KB MPSC time drops by 62% and actually beats snmalloc on the single-sender workload. However, the same tuning hurts single-threaded allocation (+96%) and multi-sender contention (+10%). - The penalty is allocation-size dependent, not async-pattern dependent. Reproducing tokio’s own
sync_mpscbenchmark with 5 senders, 1000 messages:usizepayloads show all allocators within 4%, but 32 KB Vecpayloads reproduce the exact same jemalloc regression. - jemalloc wins on small-object churn.
spawn_many_local(10,000 task spawns) is 2.02× faster under jemalloc than std. Thread-local slab caches dominate when objects stay under jemalloc’s small-class threshold. - snmalloc and mimalloc remain broadly safer on this machine. They win or tie on 10 of 13 reported cases, avoid the large-message cliff entirely, and require no
MALLOC_CONFarchaeology.
Method
All runs on a single machine to eliminate cross-hardware noise.
- Machine: OCI Ampere A1, 4 vCore ARM64 (aarch64), 24 GB RAM
- OS: Debian 13 (kernel 6.12.86+deb13-arm64)
- Page size: 4 KB
- Compiler: rustc 1.95.0, cargo 1.95.0
- Libraries: tokio 1.52.3, criterion 0.5.1
- Allocators: tikv-jemallocator 0.6.1 (jemalloc 5.3.0), mimalloc 0.1.50 (mimalloc v2.x), snmalloc-rs 0.7.4, glibc 2.41 (std)
Each bench binary sets a different #[global_allocator] and links the same lib.rs routines. Criterion.rs config: 50 samples, 3 s measurement, 1 s warmup. Build profile is Cargo’s built-in bench (opt-level 3, debug assertions off, equivalent to --release).
Reproduction:
| |
Raw numbers: bench_results.csv
Perf counters: perf_stat_results.txt
Tuning sweep: jemalloc_tuning_results.txt
Strace traces: jemalloc_strace.txt, snmalloc_strace.txt, mimalloc_strace.txt, std_strace.txt
Results
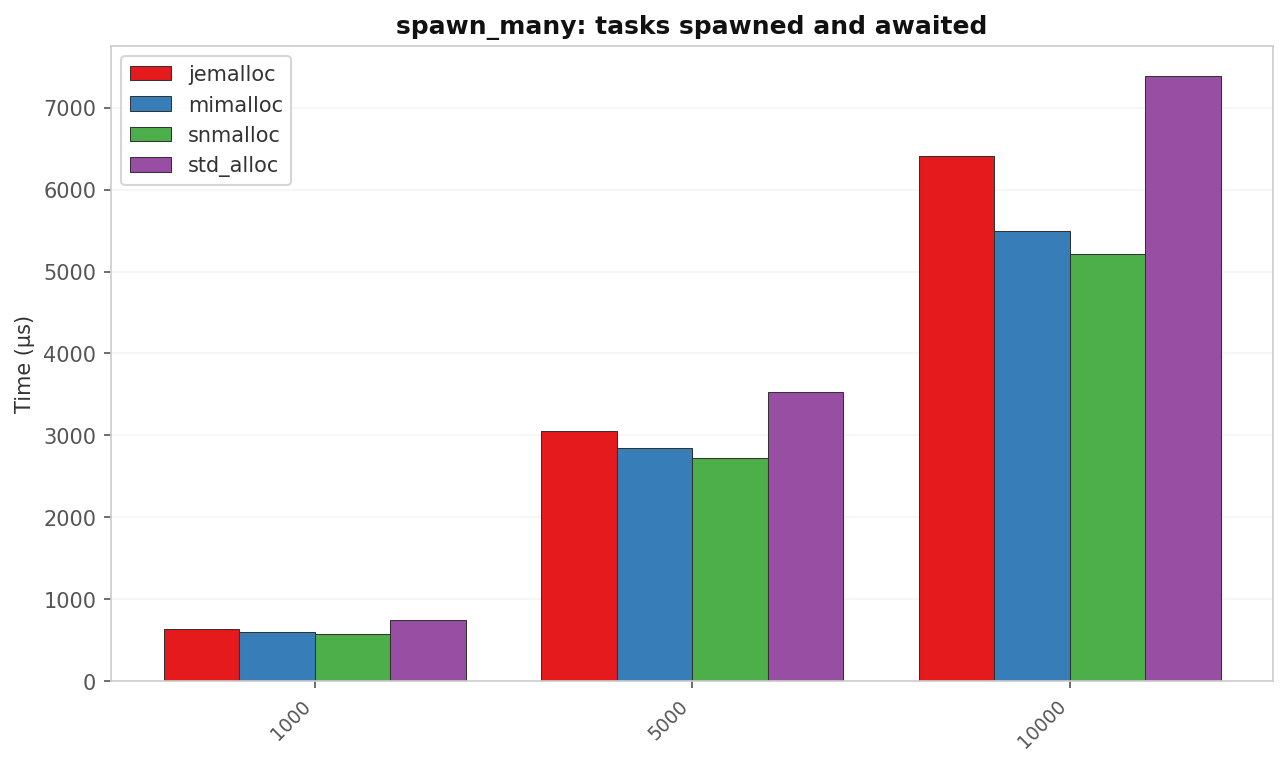
spawn_many: tasks spawned and awaited
| Tasks | std (µs) | jemalloc (µs) | mimalloc (µs) | snmalloc (µs) | snmalloc vs std |
|---|---|---|---|---|---|
| 1 000 | 748.0 | 630.3 | 594.4 | 577.4 | 1.30× |
| 5 000 | 3 524.7 | 3 053.8 | 2 847.8 | 2 727.7 | 1.29× |
| 10 000 | 7 387.5 | 6 413.5 | 5 499.0 | 5 216.4 | 1.42× |
All three alternatives beat std. The win grows with task count because each task carries a Task box, a join handle, and at least one waker allocation. On ARM64 these small frequent allocations are expensive under glibc’s default arena strategy.
mpsc: latency vs message size
| Size | std (µs) | jemalloc (µs) | mimalloc (µs) | snmalloc (µs) | Best vs std |
|---|---|---|---|---|---|
| 8 B | 139.5 | 113.3 | 112.6 | 112.5 | 1.24× snmalloc |
| 64 B | 139.3 | 119.4 | 114.5 | 114.2 | 1.22× snmalloc |
| 256 B | 170.7 | 138.4 | 115.2 | 117.3 | 1.48× mimalloc |
| 512 B | 177.5 | 161.0 | 127.6 | 125.0 | 1.42× snmalloc |
| 1 KB | 211.3 | 203.5 | 138.4 | 138.9 | 1.53× mimalloc |
| 4 KB | 264.3 | 377.1 | 267.5 | 212.9 | 1.24× snmalloc |
| 16 KB | 1 077.8 | 1 741.0 | 637.7 | 593.0 | 1.82× snmalloc |
| 32 KB | 1 875.3 | 2 299.2 | 984.4 | 970.7 | 1.93× snmalloc |
Two regimes with very different allocator behavior:
- Small messages (≤ 1 KB): snmalloc ≈ mimalloc ≪ jemalloc < std. The gap is 1.2–1.5× at most.
- Large messages (≥ 16 KB): jemalloc drops below std. At 16 KB it is 1.62× slower than glibc; at 32 KB it is still 1.23× slower. Meanwhile snmalloc and mimalloc are nearly 2× faster than std.
The size threshold where jemalloc inverts is between 4 KB and 16 KB — the transition from allocator slab caches to fresh extent/page allocation.
block_on_alloc: Vec churn inside block_on
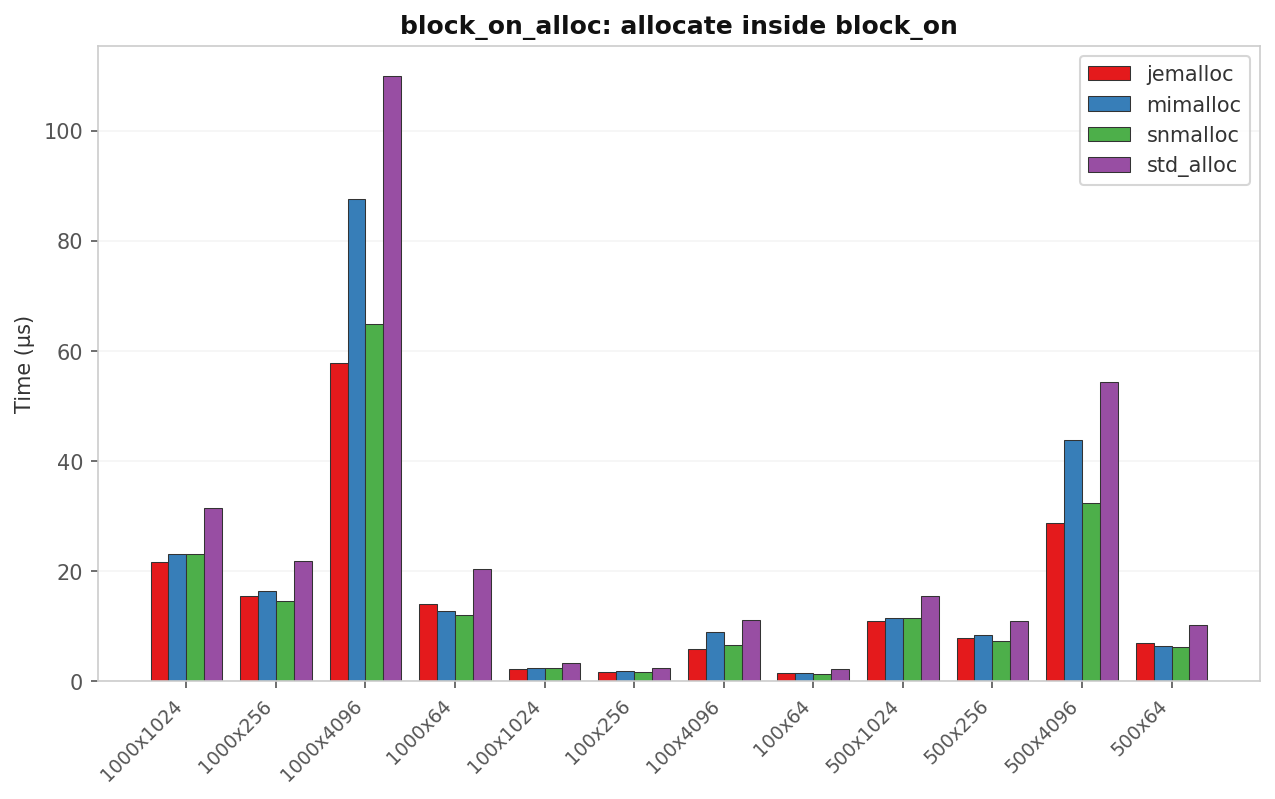
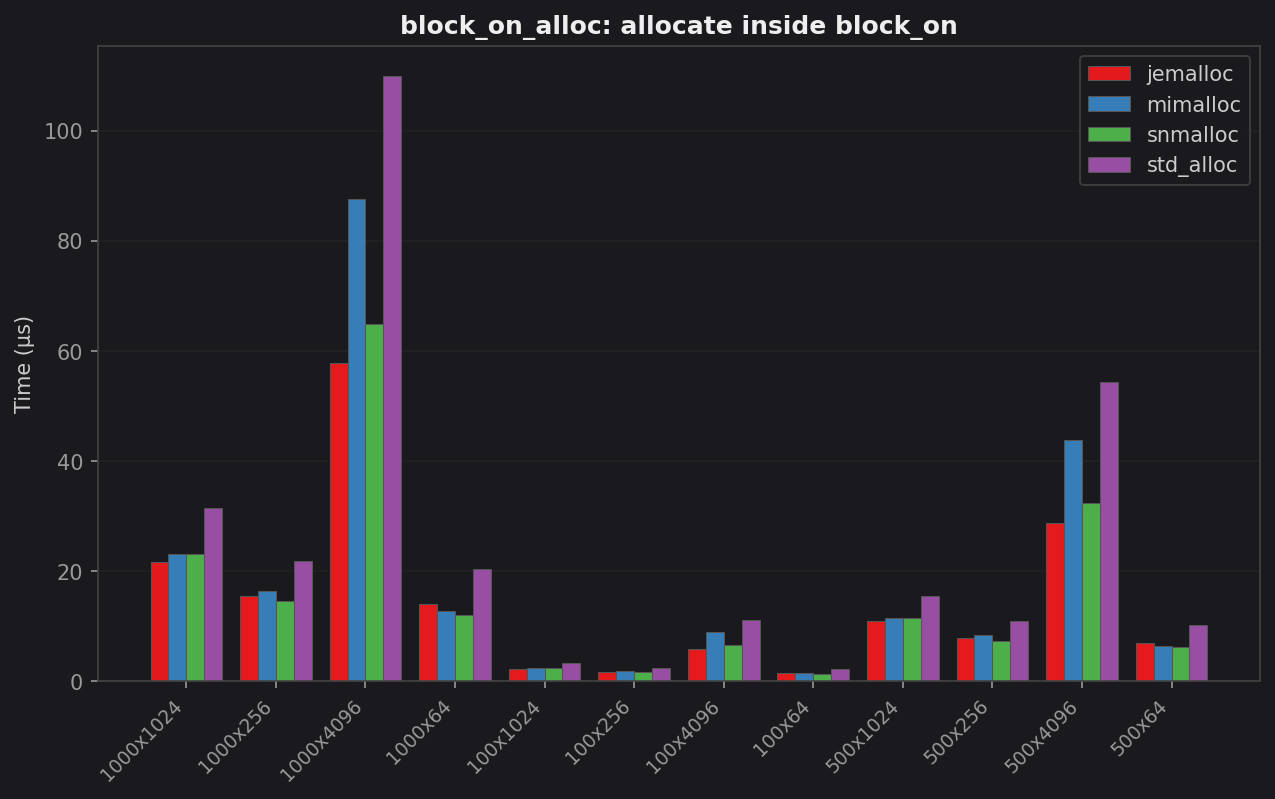
| Case | std (µs) | jemalloc (µs) | mimalloc (µs) | snmalloc (µs) | Best vs std |
|---|---|---|---|---|---|
| 100 × 64 B | 2.12 | 1.48 | 1.36 | 1.30 | 1.63× snmalloc |
| 100 × 4 KB | 11.00 | 5.84 | 8.83 | 6.55 | 1.88× jemalloc |
| 1 000 × 64 B | 20.37 | 13.97 | 12.72 | 11.90 | 1.71× snmalloc |
| 1 000 × 4 KB | 109.97 | 57.78 | 87.53 | 64.74 | 1.90× jemalloc |
jemalloc wins on large individual allocations (4 KB blobs) where its huge-page path and thread-local cache pay off. snmalloc wins on high-count small batches. mimalloc is competitive but never leads.
alloc_stress: random-size Vec churn
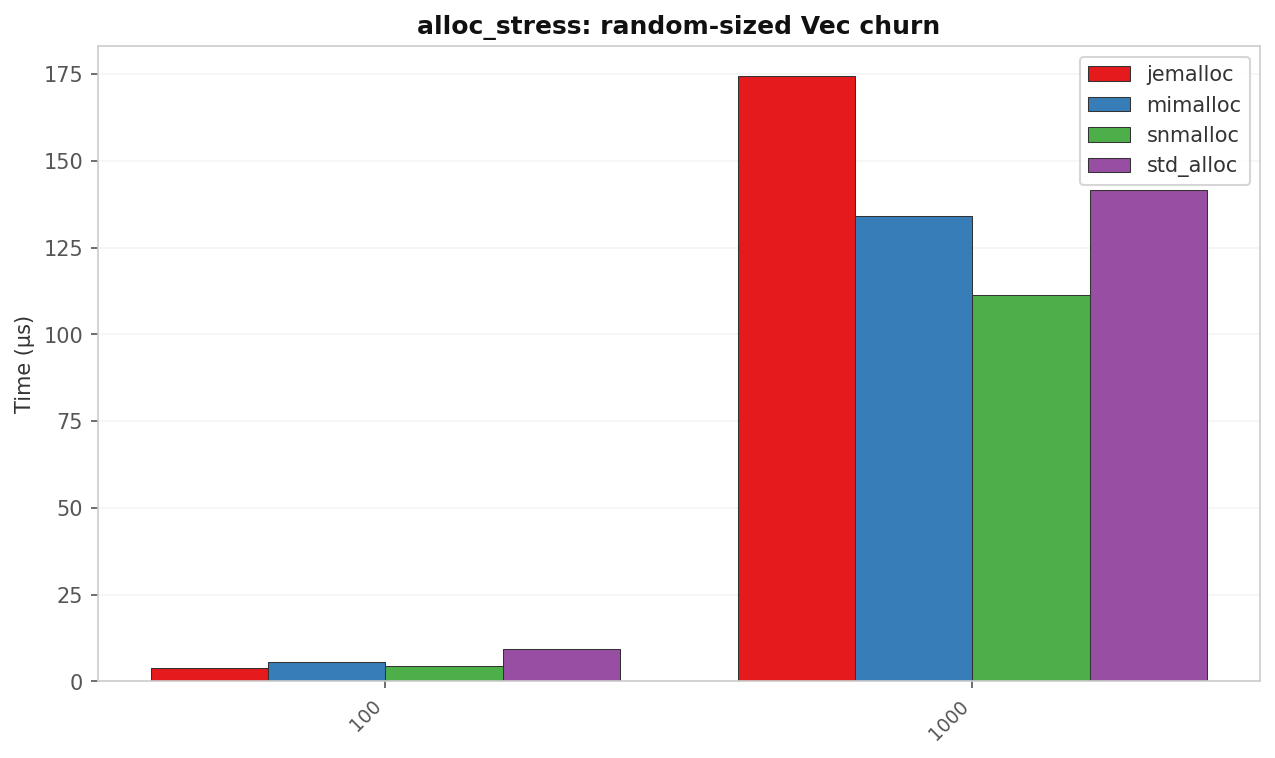
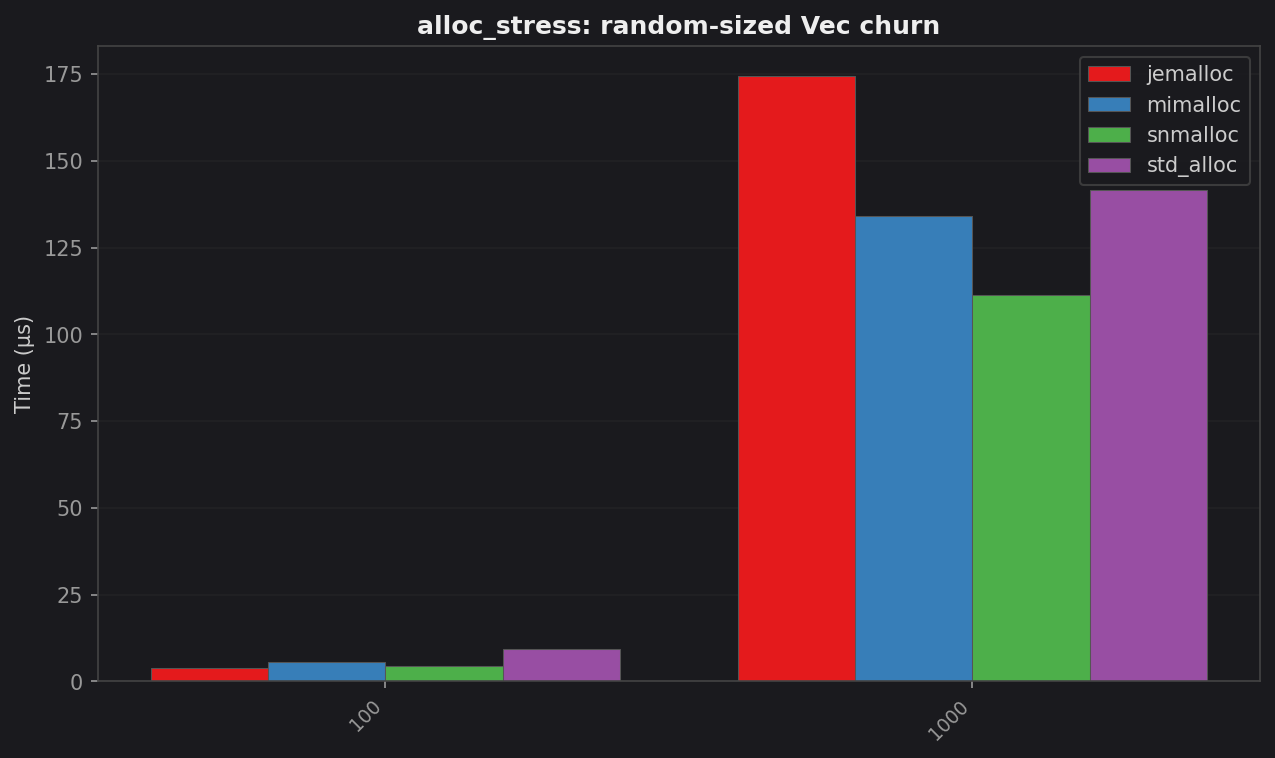
| Allocs | std (µs) | jemalloc (µs) | mimalloc (µs) | snmalloc (µs) | Best vs std |
|---|---|---|---|---|---|
| 100 | 9.37 | 3.83 | 5.45 | 4.47 | 2.45× jemalloc |
| 1 000 | 141.6 | 174.3 | 134.3 | 111.4 | 1.27× snmalloc |
jemalloc dominates the small-batch case (likely due to excellent thread-local caching). At 1 000 allocs snmalloc’s global-free-list batching takes over and it leads.
Root cause: MADV_DONTNEED vs MADV_FREE
strace -e memory on the 32 KB MPSC case reveals the mechanism. Because strace overhead slows each iteration, Criterion adapts by running fewer iterations; the counts below are per benchmark iteration (single pass of 1 000 sends + 1 000 recvs). Raw captured traces: jemalloc_strace.txt, snmalloc_strace.txt, mimalloc_strace.txt, std_strace.txt.
| Allocator | madvise / iter | brk / iter | Typical advice | Iterations captured |
|---|---|---|---|---|
| jemalloc | ~1,140 | ~0.3 | MADV_DONTNEED | 200 |
| snmalloc | ~9 | 0 | MADV_FREE | 3 825 |
| mimalloc | <0.02 | 0 | (various) | 3 825 |
| std | 0 | ~38 | n/a | 1 275 |
jemalloc issues roughly 130× more madvise calls per iteration than snmalloc, and snmalloc’s calls use MADV_FREE rather than MADV_DONTNEED.
MADV_DONTNEED tells the kernel to drop physical pages for the mapped range immediately. The virtual addresses stay valid, but the next write to any page in that range triggers a demand-zero minor page fault — the kernel must allocate a fresh physical page and zero it. On ARM64 with a 4 KB page size and smaller TLBs than x86-64, this faulting is proportionally more expensive.
MADV_FREE tells the kernel the pages may be reclaimed under memory pressure, but they stay valid in RAM until reclaim actually happens. No forced re-faulting on subsequent writes.
jemalloc is aggressively returning memory; snmalloc is deferring. The benchmark repeatedly allocates and frees 32 KB buffers through a bounded channel — exactly the workload that pings the MADV_DONTNEED / demand-fault cycle.
perf stat -e page-faults on the 32 KB MPSC case confirms the per-iteration rate. Criterion’s adaptive iteration count means totals vary; rates are reproducible.
| Allocator | Page faults / iter | Sys % of elapsed |
|---|---|---|
| jemalloc | ~1,580 | ~73% |
| std | ~1,400 | ~47% |
| mimalloc | <0.1 | <1% |
| snmalloc | <0.1 | ~4% |
jemalloc spends most of elapsed time in the kernel servicing those faults. This is not a cache-miss problem — cache miss rates are comparable across allocators. It is a syscall-level page-fault storm.
Is this a jemalloc bug?
No — it is documented behavior. The jemalloc man page explicitly describes the two purge paths:
“A lazy extent purge function (e.g. implemented via
madvise(...,MADV_FREE)) can delay purging indefinitely and leave the pages within the purged virtual memory range in an indeterminate state, whereas a forced extent purge function immediately purges, and the pages within the virtual memory range will be zero-filled the next time they are accessed.”1
The source code (jemalloc 5.3.0) shows the cascade in extent_dalloc_wrapper() (src/extent.c). On Linux with default retain:true, the flow is:
ehooks_dalloc_will_fail()returnstruebecauseopt_retainis enabled — munmap is skipped entirely.extent_decommit_wrapper()callspages_decommit()→pages_commit_impl(), which returnstrue(failure) immediately becauseos_overcommitsistrueon Linux. Decommit is a no-op on overcommitting systems.- Fall through to forced purge →
pages_purge_forced()→madvise(..., MADV_DONTNEED). - Next access to those pages = demand-zero fault.
The 228,455 MADV_DONTNEED calls are not a fallback after failed syscalls — they are the only allocator action that actually runs on this path.
jemalloc’s own TUNING.md frames this as a CPU-versus-memory trade-off:
“Decay time determines how fast jemalloc returns unused pages back to the operating system, and therefore provides a fairly straightforward trade-off between CPU and memory usage. Shorter decay time purges unused pages faster to reduces memory usage (usually at the cost of more CPU cycles spent on purging).”2
The 62% regression is simply the “more CPU cycles” side of that trade-off, amplified by ARM64’s stricter TLB behavior and the benchmark’s tight allocation loop. On a memory-constrained server the same behavior would be the correct choice; on a 24 GB machine running allocation-heavy async workloads it is not.
Could jemalloc be tuned out of this?
A common first attempt is to set MALLOC_CONF. On tikv-jemallocator 0.6.1 that variable is silently ignored — the build uses JEMALLOC_PREFIX="_rjem_", so the correct name is _RJEM_MALLOC_CONF. Any testing with MALLOC_CONF will measure the default configuration regardless of what string you pass.
Retested with _RJEM_MALLOC_CONF on the 32 KB MPSC case:
| Tune | Page faults | Per-iteration time |
|---|---|---|
| Baseline | ~2 019 635 | 2.35 ms |
retain:false | ~2 018 974 | 2.36 ms |
dirty_decay_ms:0,muzzy_decay_ms:0 | ~2 032 091 | 2.33 ms |
narenas:1 | ~2 031 085 | 2.33 ms |
tcache:false | 949 | 0.86 ms |
tcache_max:4096 | ~1 023 | 0.89 ms |
What changed
tcache:false and tcache_max:4096 do fix the regression — by 2.6–2.7× on this benchmark. The page-fault count drops from ~1,500 faults/iteration to near-zero. The other knobs (retain, decay, arenas) genuinely do nothing.
Why does limiting the tcache help? With default tcache_max, large deallocated chunks sit in the thread cache. When the cache fills, jemalloc purges them with madvise(..., MADV_DONTNEED). The next allocation from the same thread immediately reclaims from the tcache and touches those zeroed pages → demand-zero fault. The strace data shows this clearly: baseline jemalloc triggers ~1,140 madvise calls per iteration, each followed by a fault on reuse.
With tcache_max:4096, allocations ≥ 4 KB bypass the tcache and flow through the arena’s extent management. Notably, the madvise count does not drop — in fact it rises slightly to ~1,300 calls/iteration — but those purged extents are no longer on the immediate-reuse hot path. The next allocation tends to come from a different, non-purged extent, so demand-zero faults collapse from ~1,580/iteration to near-zero.
This is why the fix is so pattern-dependent: it only helps when the benchmark’s allocation pattern immediately reclaims from the same thread’s cache. When a single thread does all the work (block_on_alloc_st) or when many senders share the channel (tokio_mpsc_large), bypassing the tcache forces allocations through the slower arena path and makes things worse.
The catch — pattern dependence
The fix is not universal:
| Pattern | Baseline jemalloc | tcache_max:4096 | Change |
|---|---|---|---|
| mpsc/32 KB (1 sender) | 2.35 ms | 0.89 ms | −62% ✅ |
| mpsc/16 KB (1 sender) | 1.79 ms | 0.83 ms | −54% ✅ |
| mpsc/1 KB (1 sender) | 209 µs | 205 µs | −2% ✅ |
| mpsc/8 B (1 sender) | 113 µs | 113 µs | 0% ✅ |
| tokio_mpsc_large/5×1000_32 KB (5 senders) | 4.27 ms | 4.70 ms | +10% ❌ |
| block_on_alloc_st/1000×32 KB (single-threaded) | 390 µs | 763 µs | +96% ❌ |
| spawn_many/10 000 | 6.41 ms | 6.55 ms | ~+2% (within noise) |
tcache_max:4096 is a win for cross-thread, single-pair channel workloads with multi-KB messages, but it hurts single-threaded and multi-sender patterns. The mechanism is workload-specific, not a general jemalloc panacea.
Practical option
If your service is dominated by large MPSC messages and you are locked into jemalloc, _RJEM_MALLOC_CONF=tcache_max:4096 is worth testing. A more conservative starting point is _RJEM_MALLOC_CONF=tcache_max:16384, which fixes 32 KB while keeping 16 KB in cache (16 KB stays at ~1.78 ms).
For most users, snmalloc and mimalloc avoid the cliff without requiring per-workload tuning. tcache_max:4096 has no effect on small-object churn like spawn_many (within noise) and hurts single-threaded large allocations and multi-sender channel contention.
Is this tokio-specific, or universal?
I replicated six patterns drawn directly from tokio’s own benchmark suite to test whether the effect is specific to multi-threaded async, channels, or something else.
| Pattern | Type | std (µs) | jemalloc (µs) | snmalloc (µs) | Key finding |
|---|---|---|---|---|---|
spawn_many_local/10k | MT spawn | 10 693 | 5 289 | 5 393 | jemalloc wins (2× std) |
spawn_many_remote_idle/10k | MT spawn | 8 050 | 6 237 | 5 021 | snmalloc wins |
mpsc_contention/5x1000 | MT channel (usize) | 1 236 | 1 216 | 1 194 | All tied within 4% |
mpsc_large/5x1000_32KB | MT channel (32 KB) | 4 485 | 4 314 | 3 299 | jemalloc loses — reproduces cliff |
block_on_alloc_st/1000x32KB | ST alloc only | 402 | 390 | 366 | snmalloc wins; not async-specific |
spawn_st/1k | ST spawn | 336 | 275 | 244 | snmalloc wins; not MT-specific |
Three conclusions emerge:
usizecontention (tokio’s realsync_mpscbench): allocator barely matters. Small objects short-circuit jemalloc’sMADV_DONTNEEDpath.- Large
Vec<u8>payloads reproduce the cliff even with tokio’s ownsync_mpsccontention pattern. The issue is not our custom harness. - Single-threaded
block_onwith 32 KB allocs shows the same penalty. This is not an async-specific or multi-thread-specific pathology. It is an allocator-allocation-size interaction that happens to be exposed by Tokio channels when messages are multi-KB.
Summary
| Workload | Winner | std vs best | Key driver |
|---|---|---|---|
| spawn_many | snmalloc ≈ mimalloc | 1.42× | Small-object fast path |
| mpsc small | snmalloc ≈ mimalloc | 1.24–1.53× | Thread cache, low coordination |
| mpsc large (untuned) | snmalloc ≈ mimalloc | ~1.93× | MADV_FREE avoids fault storm |
mpsc large (jemalloc, tcache_max:4096) | jemalloc | ~2.6× vs untuned jemalloc | Bypass tcache to avoid madvise reuse cycle |
| block_on_alloc (small) | snmalloc | 1.71× | Batch deallocation |
| block_on_alloc (large) | jemalloc | 1.90× | Huge-page / slab path |
| alloc_stress (small) | jemalloc | 2.45× | Thread-local cache |
| alloc_stress (large) | snmalloc | 1.27× | Global-free-list batching |
Appendix: Does this reproduce on x86-64?
All numbers so far are from an OCI Ampere A1 (ARM64, 4 vCore). To test whether the effect is architecture-specific, I ran the same benchmark suite on an AMD Ryzen 9 9900X (16C/32T, 64 GB DDR5, x86-64, Debian, kernel 6.x, 4 KB pages).
Key results on x86-64
| Workload | std | jemalloc | mimalloc | snmalloc | tcache_max:4096 |
|---|---|---|---|---|---|
| mpsc/16 KB | 387 µs | 728 µs (+88%) | 226 µs | 241 µs | 394 µs (+2%) |
| mpsc/32 KB | 744 µs | 1 004 µs (+35%) | 382 µs | 406 µs | 393 µs (−47%) |
| block_on_alloc/1000×4 KB | 43.6 µs | 21.5 µs (−51%) | 37.9 µs | 20.9 µs (−52%) | 23.2 µs (−47%) |
| spawn_many/10 000 | 2.62 ms | 3.13 ms (+19%) | 3.04 ms | 3.51 ms | 4.48 ms (+71%) |
| tokio_mpsc_large/5×1000_32KB | 902 µs | 1.80 ms (+100%) | 1.74 ms | 1.52 ms | 2.78 ms (+208%) |
Three findings stand out.
1. The jemalloc regression is present on x86-64 too, and at some sizes it is worse. At 16 KB, jemalloc is 1.88× slower than std on x86-64 versus 1.62× on ARM64. At 32 KB the gap narrows to 1.35× versus 1.23× on ARM64. The direction is identical; the magnitude depends on the exact size threshold between slab and extent allocation on each platform.
2. tcache_max:4096 fixes the single-sender large-MPSC case on x86-64 as well.
32 KB drops from 1.0 ms to 393 µs — a 61% improvement, almost exactly the 62% seen on ARM64. The mechanism is the same: bypassing the thread cache avoids the immediate-reuse of MADV_DONTNEED-purged extents.
3. The pattern-dependence is identical. The same tuning hurts multi-sender contention (+208% on tokio_mpsc_large, versus +10% on ARM64) and single-threaded allocation (+71% on spawn_many, versus ~0% on ARM64). The variance in magnitude is platform-specific, but the sign is the same.
strace confirms the same syscall pattern
strace -f -e memory on the 32 KB MPSC case shows the same mechanism at much lower absolute counts (the x86-64 machine runs more iterations per sample):
| Allocator | madvise calls | Iterations | MADV_DONTNEED / iter | MADV_FREE / iter |
|---|---|---|---|---|
| jemalloc | 422 | 3 825 | 0.11 | <0.001 |
| std | 48 | 5 100 | 0.009 | — |
| mimalloc | 31 | 8 925 | 0.003 | 0 |
| snmalloc | 56 | 7 650 | 0.006 | 0.001 |
jemalloc issues roughly 12× more MADV_DONTNEED calls per iteration than std on x86-64, and snmalloc again uses MADV_FREE instead. The ratio is lower than on ARM64 (where it was ~130×), but the direction is unchanged. The effect is an allocator behavior, not an ARM64 pathology.
Platform differences worth noting
- spawn_many: std wins on x86-64 (2.62 ms) while snmalloc wins on ARM64 (5.22 ms). glibc’s arena strategy performs better on the larger x86-64 cache hierarchy.
- Absolute latencies: x86-64 is roughly 2–3× faster across the board, as expected from a much faster CPU. The relative allocator rankings, however, are preserved.
Take
jemalloc is not “bad on ARM64.” It is appropriately aggressive for memory-tight servers and inappropriately aggressive for allocation-heavy, page-reuse workloads. Its MADV_DONTNEED strategy triggers a demand-zero fault storm when large buffers are repeatedly allocated and freed — the exact pattern produced by multi-KB MPSC messages. The same regression appears on x86-64 (see Appendix), so this is allocator behavior, not architecture-specific.
The practical rule is still: if your Tokio service pushes > 4 KB through channels, test snmalloc or mimalloc first. They avoid the cliff with no configuration.
If you are already committed to jemalloc, _RJEM_MALLOC_CONF=tcache_max:4096 can recover the loss on single-pair channel workloads, but it is a sharp knife: measure your own pattern before deploying it. The only tuning that matters here is controlling the tcache size threshold.
One final, counter-intuitive result: perf stat shows cache-miss rates are higher for snmalloc than jemalloc on the large MPSC case (1.51% vs 0.96%). snmalloc is winning despite worse cache behavior because its page-fault count is near-zero. The bottleneck on this workload is kernel entry/exit, not cache hierarchy.