I’ve added enough features to this site that I can’t keep them all in my head anymore. This post demos every single one that currently works, exactly as you’d use it, so you have a reference you can actually trust.
If a pattern is shown here, it survived the last deploy.
Before you guess at syntax for your next post, check this page—if the example renders, the pattern is still production-ready.
KaTeX Math
I’ll never forget the day I realized $E = mc^2$ isn’t just a slogan—it’s a unit conversion. Mass literally is energy, and the speed of light squared is the exchange rate that lets you flip between them.
The Gaussian integral $\int_{-\infty}^{\infty} e^{-x^2} , dx = \sqrt{\pi}$ still feels like black magic. No elementary antiderivative exists, yet the area under that curve snaps to exactly the square root of pi, and that single fact props up half of statistical mechanics.
What other impossible-looking definite integrals are hiding exact closed forms if you just know where to look?
Mermaid Diagram
graph TD
    A[Human on Discord] -->|chat| B[Hermes Agent on machine A]
    B -->|SSH / task exec| C[VM on machine B]
    C -->|research & experiments| D{Findings look good?}
    D -->|human confirms| E[Write Markdown / Typst / JS]
    E --> F[Hugo static site build]
    F --> G[Caddy HTTPS server]
    G --> H[https://saulire-findings.punkeel.com]
Typst Figure
I keep my figure sources next to the content that references them.
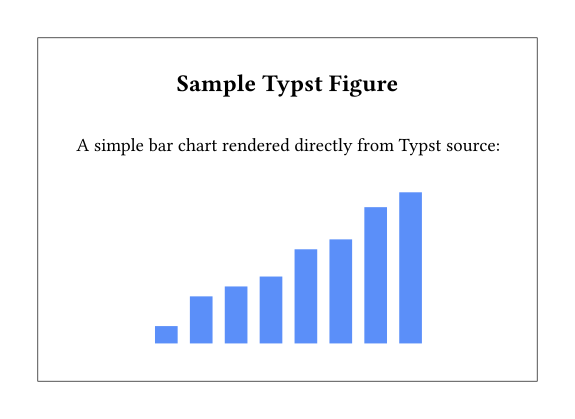
The graphic below is a vector graphic rendered directly from Typst source. It lives alongside this post as a page resource.
Treating illustrations as page resources keeps the build pipeline transparent, but it also raises a question: why do so many content systems still split images and text into completely different namespaces?
p5.js Sketch
A minimal rotating cube in WebGL mode:
Chart.js Data Chart
You have better things to do than export PNGs every time your benchmark numbers shift. I started using the chartjs shortcode so my data lives directly in the Markdown and renders as an interactive line chart via Chart.js.
Chart.js handles the rendering client-side, which means no build-time image generation and no external files to sync. You declare the dataset right next to the paragraph that references it, so the source stays the single source of truth.
What regressions would you catch earlier if your readers could explore the raw scaling data instead of squinting at a screenshot?