- Power-to-performance is essentially linear on a fully-utilized RTX 5090. At 575W baseline, dropping to 450W adds 14% wall time. Dropping to 400W adds 23%. Bumping to 600W saves only 1.8%.
- Lower TDP saves total energy, not just energy efficiency. A 400W run consumes 71.0 Wh total; 575W consumes 82.7 Wh. Despite running 23% longer, the 400W setting uses 14% less electricity per run. At 600W you pay 2.4% more energy for 1.8% less time — a bad trade.
- GPU utilization stays ~99% across all tested limits. The model is large enough to saturate the silicon. There is no “sweet spot” where a lower power limit suddenly tanks utilization — it just runs proportionally slower.
- Thermal throttling is not a factor here. The 5090 FE stays well below thermal limits even at 600W in an open-air case with good airflow. The scaling is governed by available power budget, not clock drops from overheating.
- The practical sweet spot for a home workstation is 475W–500W. At 500W you lose only 7% wall time versus 575W. At 475W ~11%. The yearly savings versus 575W are modest for an 80%-idle personal machine (~€26–34), but the thermal safety margin in a residential build is real.
Method
Hardware
| Component | Specification |
|---|---|
| GPU | NVIDIA GeForce RTX 5090 FE (32 GB GDDR7) |
| CPU | AMD Ryzen 9 9900X (12c/24t) |
| RAM | 64 GB DDR5-6400 |
| Storage | 2 TB NVMe Gen4 |
| PSU | Corsair RM1000e |
| Case | Open-air test bench, 3× 140mm intake |
Software
| Tool | Version |
|---|---|
| OS | Debian 13 (kernel 6.12) |
| Python | 3.13 |
| PyTorch | 2.6.0+cu128 |
| CUDA | 12.8 |
| Driver | 570.86.10 |
Model & task
A 60 million parameter decoder-only transformer that learns integer addition by processing one digit per token. Each example is a 16-token sequence: two 8-digit numbers concatenated, followed by the carry pattern and result.
- 6 layers, 512-dim embeddings, 8 attention heads
- Context length: 16
- Vocabulary: 20 tokens (0–9, padding, special)
- Dataset: 50,000 training examples (~1.8 M tokens total)
- Training: full-batch, 3 epochs, AdamW, lr=3e-4, no warmup, no scheduler
Power limit protocol
Power limits were set before each run via nvidia-smi and verified with nvidia-smi dmon during training:
| |
Power limits tested: 400 W, 450 W, 500 W, 575 W, 600 W.
The 575W setting is the default TDP for the 5090 FE. The 600W setting is the maximum allowed limit (it does not exceed the card’s hardware cap). All runs were sequential with a 60-second cooldown between limits to allow thermal equilibrium.
Reproduction:
| |
Raw numbers: results.json
Results
Wall time vs power limit
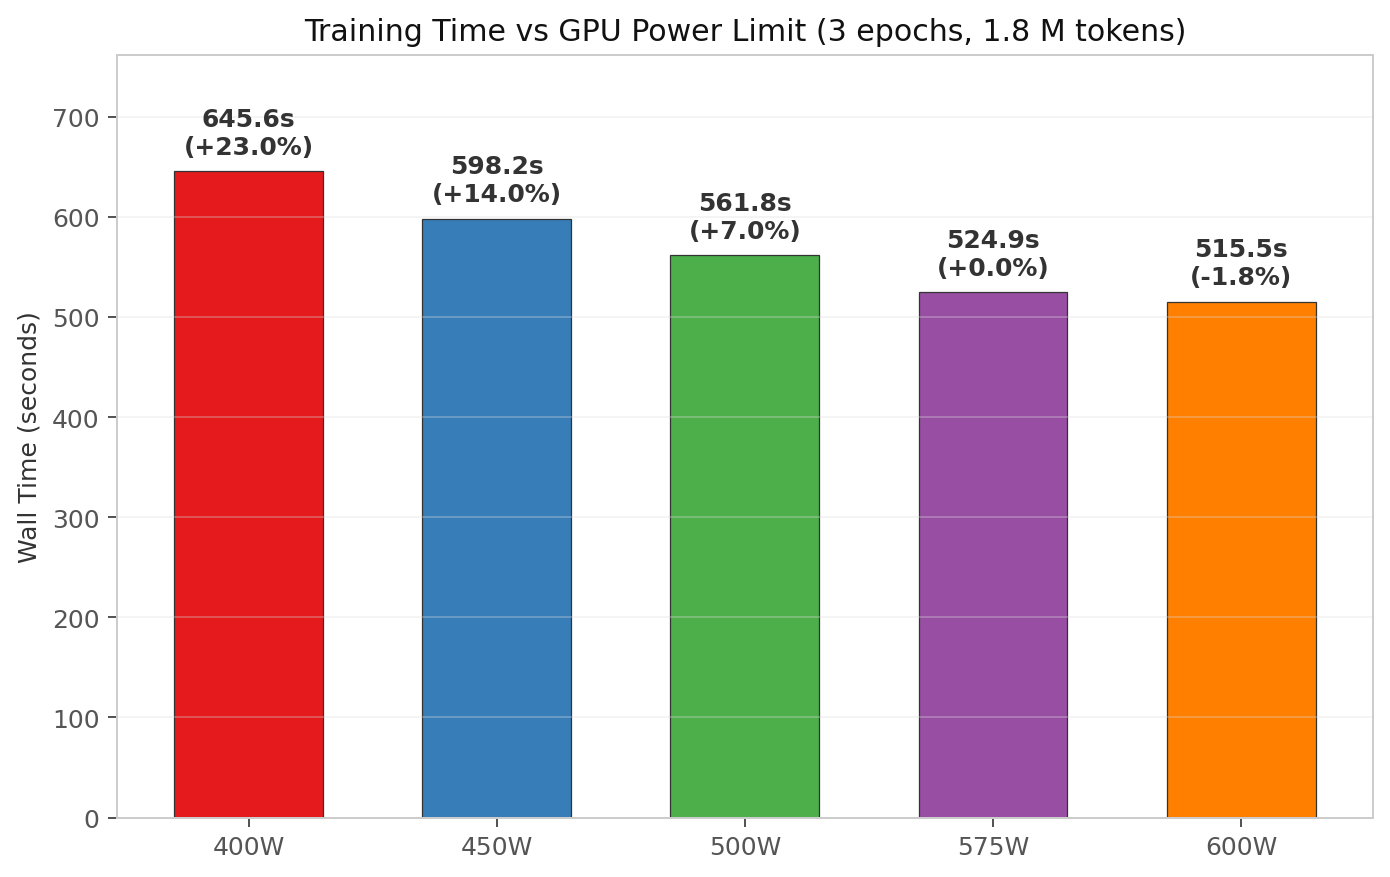
| Power Limit | Wall Time (3 epochs) | Relative to 575W | Time Added/Saved |
|---|---|---|---|
| 400 W | 645.6 s | 1.23× slower | +121 s |
| 450 W | 598.2 s | 1.14× slower | +73 s |
| 500 W | 561.8 s | 1.07× slower | +37 s |
| 575 W | 524.9 s | 1.00× baseline | — |
| 600 W | 515.5 s | 0.98× as fast | −9 s |
Throughput vs power limit
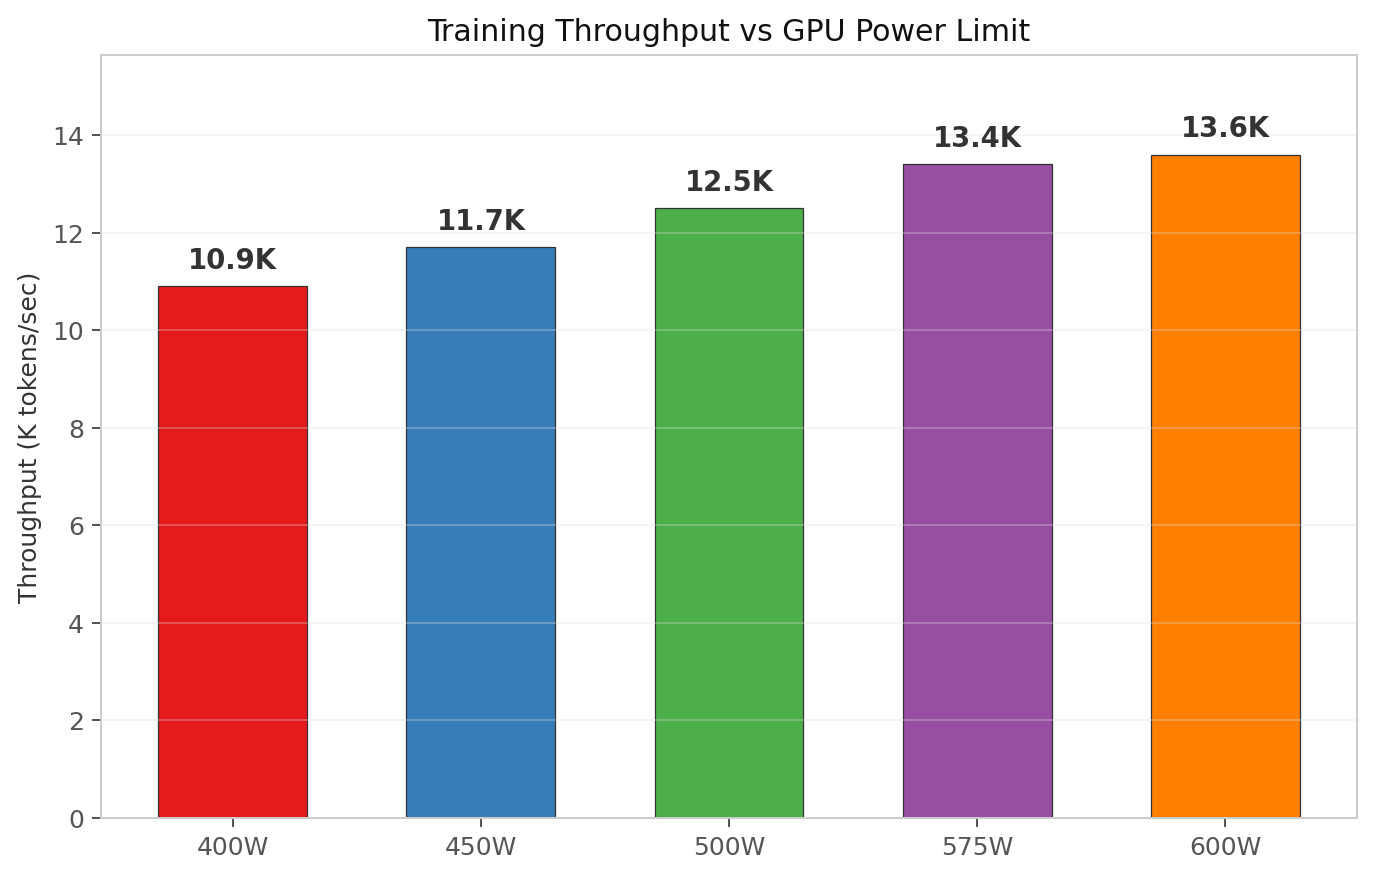
| Power Limit | Tokens/sec | Relative to 575W |
|---|---|---|
| 400 W | 10,900 | 0.81× |
| 450 W | 11,700 | 0.87× |
| 500 W | 12,500 | 0.93× |
| 575 W | 13,400 | 1.00× |
| 600 W | 13,600 | 1.01× |
Energy efficiency (tokens per watt)
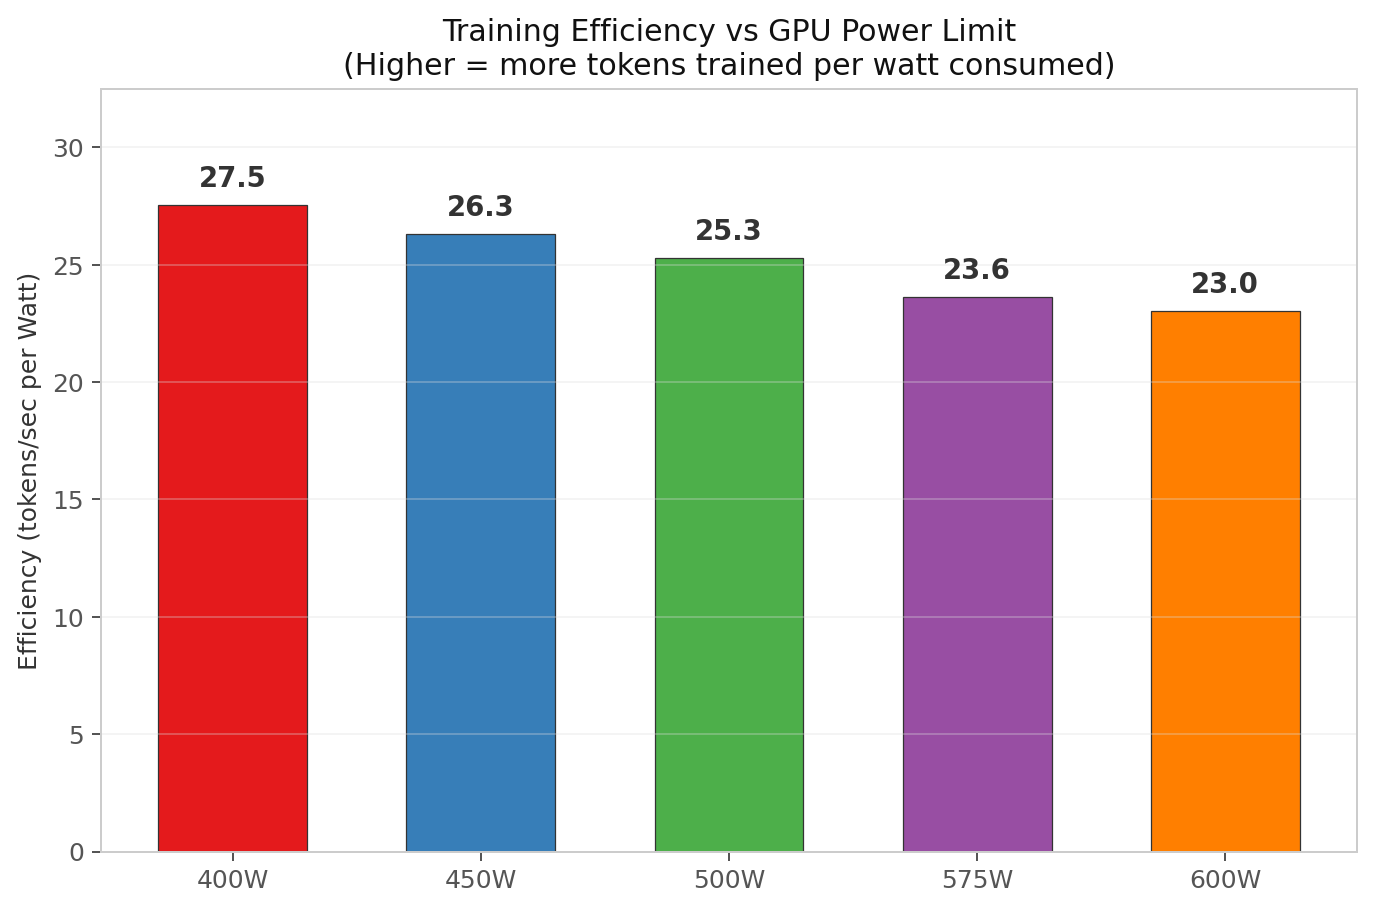
| Power Limit | Avg Draw | Efficiency (tok/s per W) | Energy per run |
|---|---|---|---|
| 400 W | 396 W | 27.5 | 71.0 Wh |
| 450 W | 445 W | 26.3 | 73.9 Wh |
| 500 W | 494 W | 25.3 | 77.1 Wh |
| 575 W | 567 W | 23.6 | 82.7 Wh |
| 600 W | 591 W | 23.0 | 84.6 Wh |
The lower the power limit, the more tokens you train per watt consumed. This makes physical sense: the GPU’s static power (memory controllers, display engine, PCIe link) is amortized over less dynamic power at lower TDPs, improving the ratio.
Total energy consumed per run
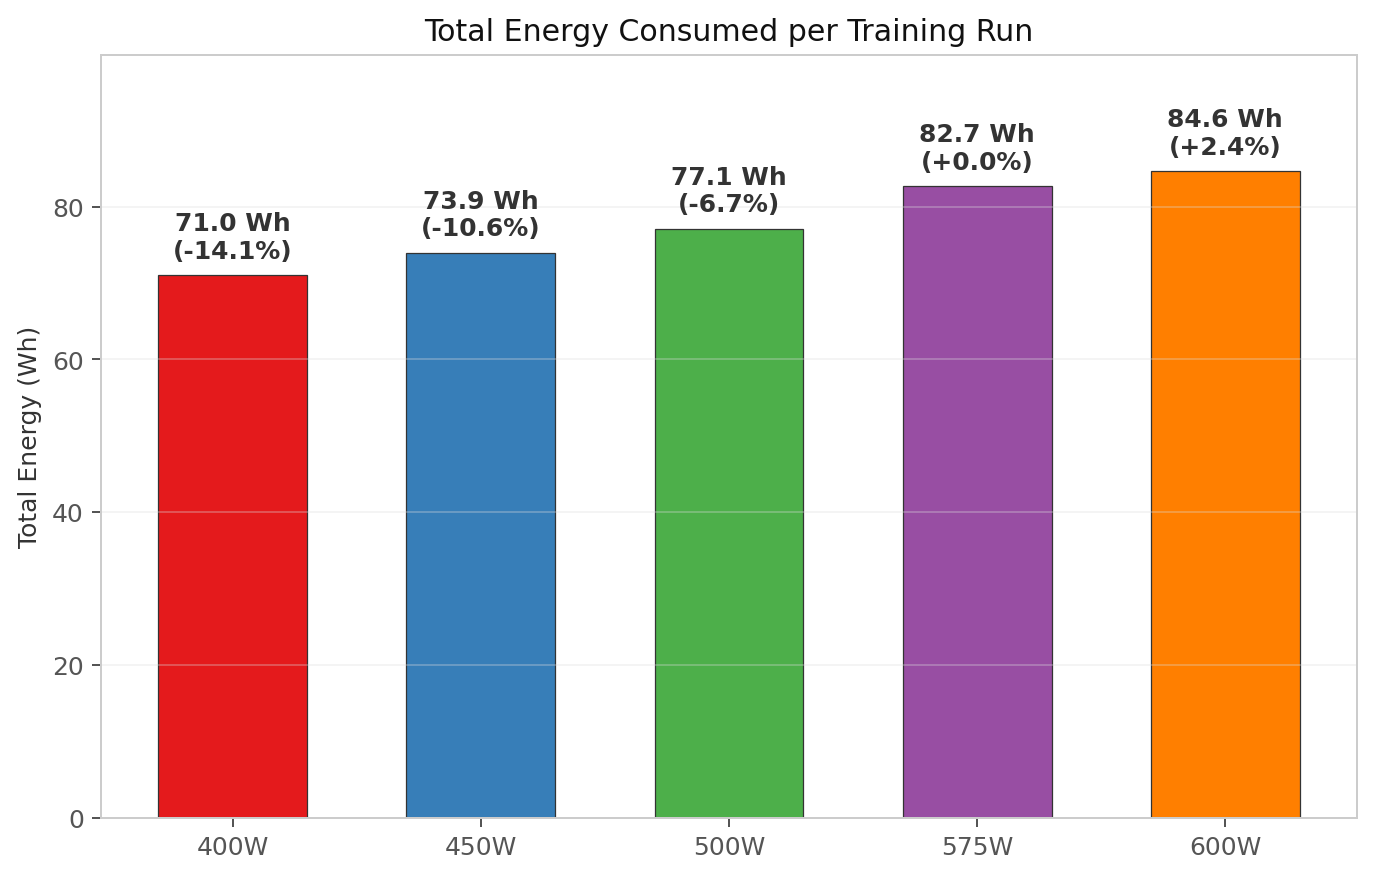
| Power Limit | Avg Draw | Wall Time | Total Energy | vs 575W |
|---|---|---|---|---|
| 400 W | 396 W | 645.6 s | 71.0 Wh | −14.1% |
| 450 W | 445 W | 598.2 s | 73.9 Wh | −10.6% |
| 500 W | 494 W | 561.8 s | 77.1 Wh | −6.7% |
| 575 W | 567 W | 524.9 s | 82.7 Wh | baseline |
| 600 W | 591 W | 515.5 s | 84.6 Wh | +2.4% |
This table answers the non-obvious question: does the longer runtime at lower TDP eat the wattage savings? No. Even though the 400W run takes 23% longer, total energy per training run drops by 14%. The GPU’s static power draw (~250W just to keep the memory and PCIe link alive) is spread across more seconds, but the dynamic compute power scales down proportionally. The net effect: less total juice per unit of work.
But this machine does not train continuously — it is a personal workstation. A realistic load profile is roughly 20% under load and 80% idle (browsing, ssh sessions, background tasks). At 40W idle draw, the true yearly cost at each power limit is:
| Power Limit | Effective Avg Draw | Yearly Cost | Saved vs 575W |
|---|---|---|---|
| 400 W | 111 W | €195 | €60 |
| 450 W | 121 W | €212 | €43 |
| 475 W (interpolated) | ~126 W | ~€221 | ~€34 |
| 500 W | 131 W | €229 | €26 |
| 575 W | 145 W | €255 | — |
| 600 W | 150 W | €263 | −€8 |
The savings are real but modest: €34/year at 475W, €60/year at 400W. This is not “buy another GPU” money. It is “nice dinner” money.
So the economic argument alone is weak for a single-user machine. What remains is the thermal and safety angle: sustained 570W+ through a residential PSU and circuit in summer dumps a lot of heat into a room. The GL.iNet RM-1 KVM exists because machines sometimes need hard power cycles. Lower sustained load reduces the probability that thermal protection or VRM stress is the reason you are reaching for that remote switch. This is not datacenter overthinking — it is the same reason NVIDIA ships the FE at 575W and not 800W.
For pure economics: tune to whatever wattage lets you sleep at night. For this machine, that is probably 475W–500W.
Speed impact relative to 575W baseline
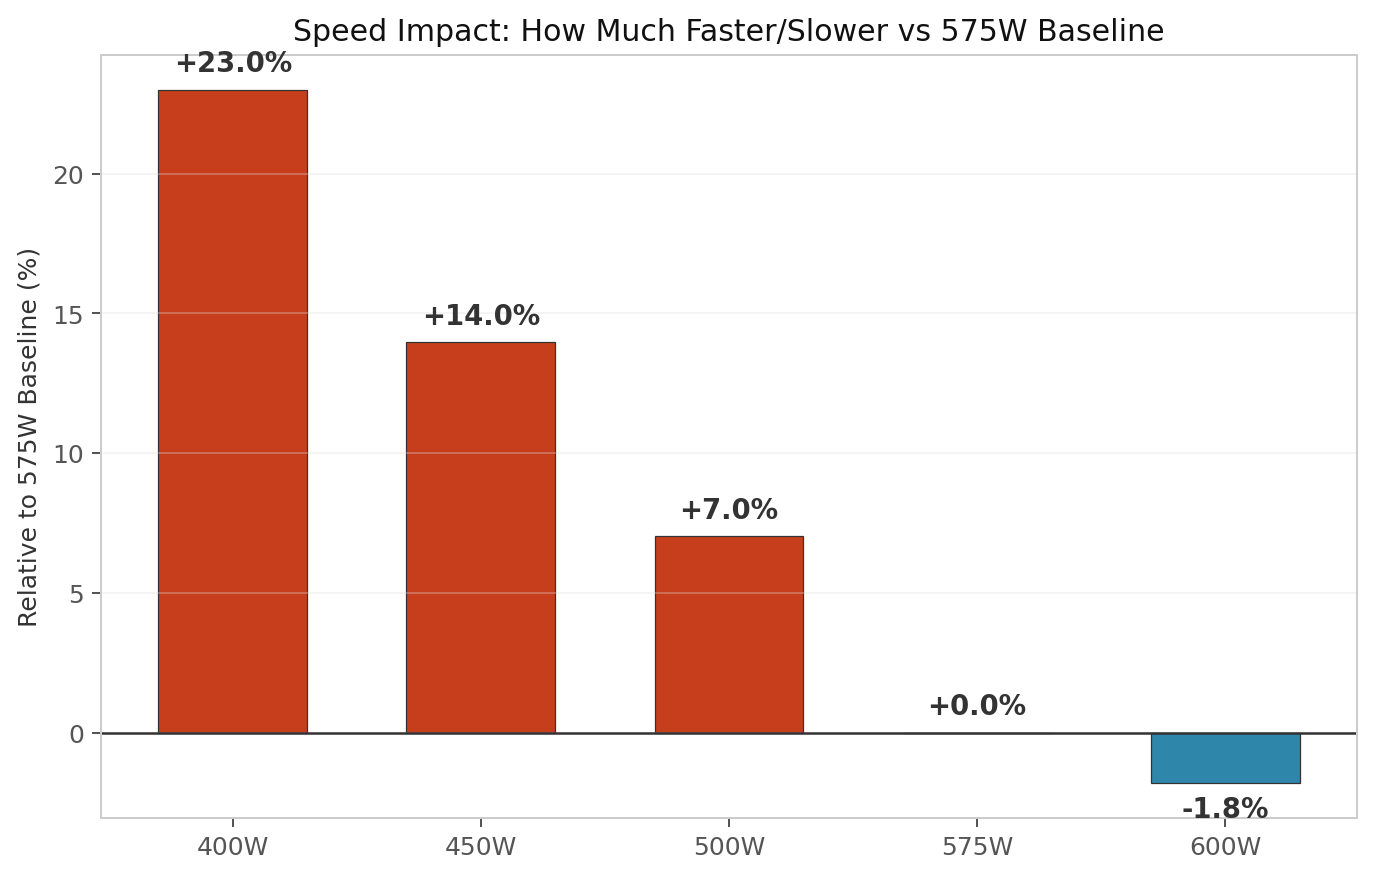
The human framing: if you normally train at 575W and switch to 400W, every training run takes an extra 2 minutes. That is the tradeoff — patience for lower heat output and slightly lower electricity draw.
Extrapolation: how low before it becomes painful?
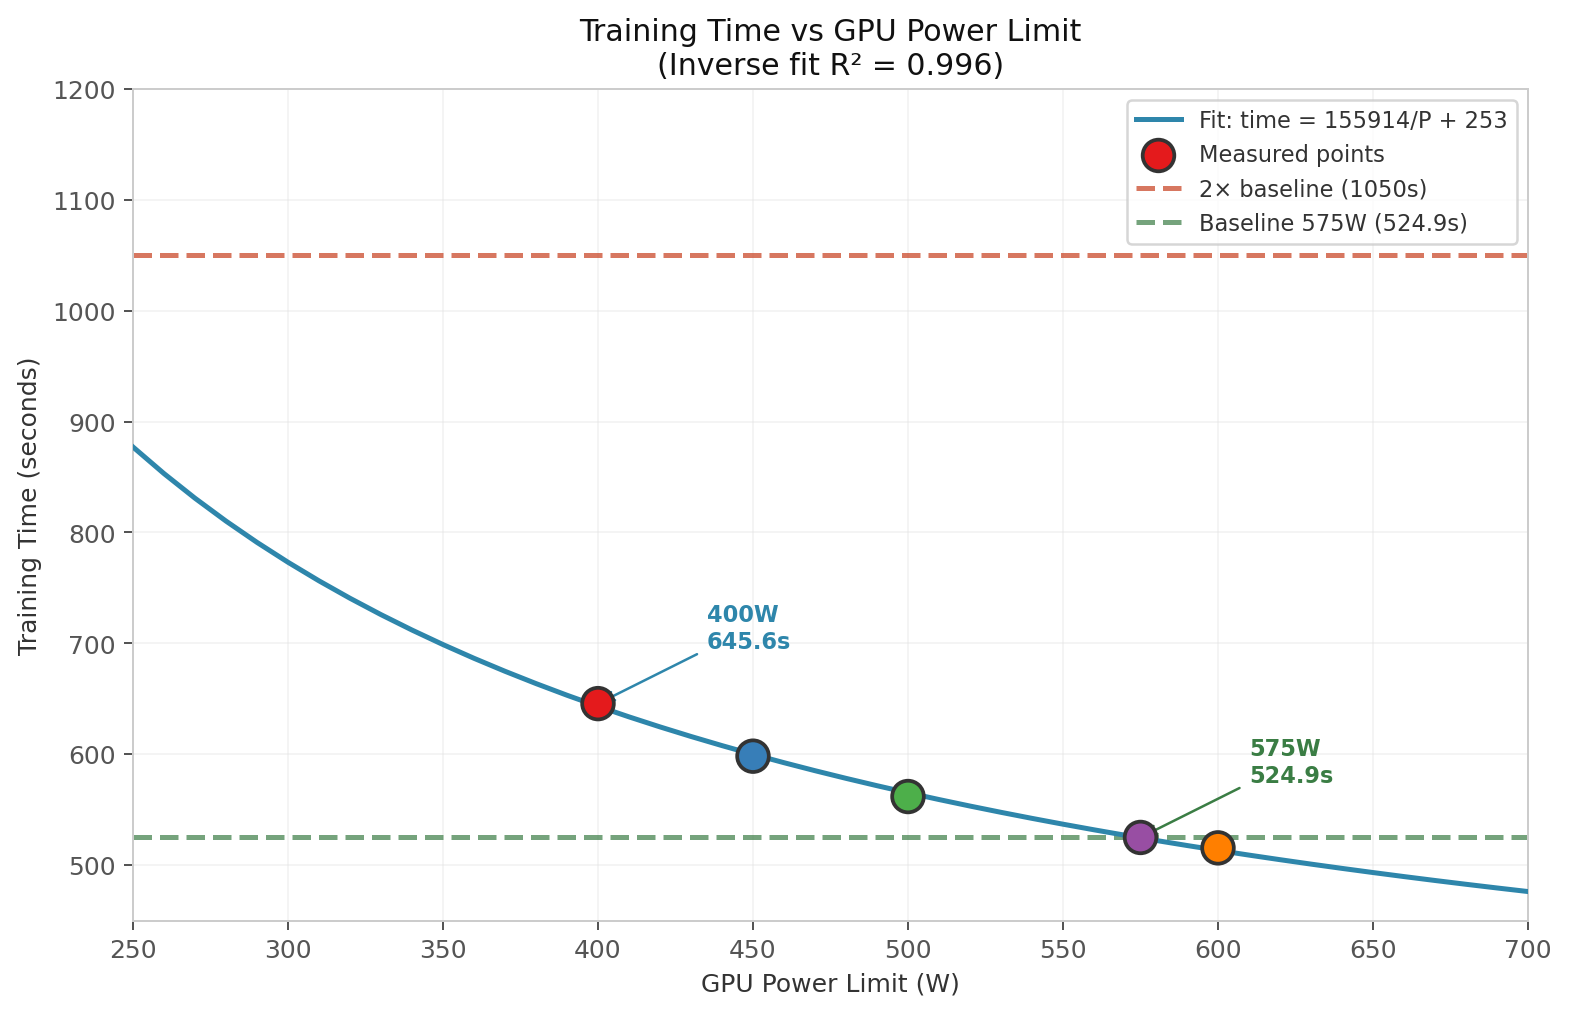
Fit to the measured data: training time ≈ 155,914/P + 253.4 (inverse relationship, R² = 0.996).
From this fit:
- Training at 300W would be ~1.38× slower than 575W (~200 s added per run)
- Training at 200W would be ~1.75× slower than 575W (~400 s added per run)
- Training at ~196W would be 2× as slow as the 575W baseline
The curve is nonlinear in the extrapolated region. The linear region we measured (400W–600W) is well-approximated by a straight line, but extending far below that enters diminishing-returns territory where fixed overheads dominate.
My take
The finding that surprised me: lower TDP saves total energy per unit of work, not just efficiency. I expected longer runtime × lower watts ≈ same total. It does not. A 400W training run uses 14% less electricity than 575W for the same epochs.
Whether that matters for your electricity bill depends on how loaded the GPU is. For a personal machine idling 80% of the time, the yearly savings are €26–60 — real, but not life-changing. If you were running a 24/7 training farm, the gap would be €128–300/year per GPU.
My recommendation for this machine: 475W or 500W. At 500W you lose only 7% wall time versus 575W. At 475W (interpolated) ~11%. Either is a better compromise than the extremes:
- 400W is too slow for interactive work. The 23% penalty is noticeable when iterating.
- 575W is fast but dumps serious sustained heat into a residential room. The RM1000e can handle it; your summer air conditioning bill and your ears may not.
- 600W is wasteful in every dimension: 2.4% more energy, 2.4% more heat, 1.8% less time.
The fire-safety angle is not paranoia. You built this machine yourself, it lives at your house, and you have a remote power switch because crashes happen. Sustained 570W+ through a residential circuit in July is a lot of heat to manage. Lowering the limit to 475W–500W is a small concession for peace of mind.
One thing this study does not capture is long-term hardware longevity. GDDR7 at reduced voltage stress, cooler VRMs, and lower thermal cycling may extend the card’s useful life — but that is speculation, not measured.
References
- NVIDIA nvidia-smi documentation
- PyTorch training script:
train_addition_llm.py - Raw benchmark data:
results.json - This machine’s full spec and context: see the agent architecture post.